
Trello is a popular productivity tool that enables individuals and teams to manage and track their projects. Its system of visual boards, lists, and cards, together with drag and drop functionality, allows users to accomplish work in an easy and fun way. The simplicity of the interface appeals to many people looking for a better way to get things done, last reported to be about 25 million in October 2017. And so, teams and businesses get off to a great start. Tasks are completed, cards are moved, workflows are established, processes are followed, and projects are delivered. But how much work was accomplished?
Missing Features
We can only improve what we can measure, according to modern business management guru Peter Drucker. Trello’s boards, lists, and cards provide clear information on what exactly is going on and at what stage each project is. Aside from that, users have to look somewhere else to get more information. As in any business, reports are valuable tools that can help track and analyze performance and overall business health. They can reveal important information, glaring, subtle, or otherwise, that can be critical for business growth. The use of charts in reports provide information at a glance. Charts allow the reader to grasp visually the message being conveyed.
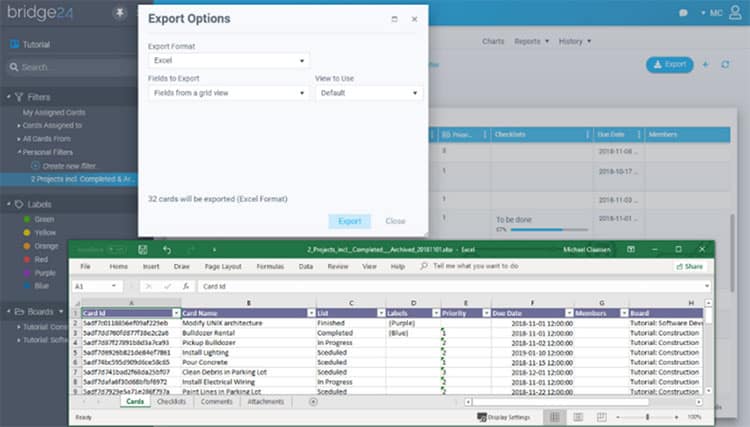
Unfortunately, charts and reporting tools are not built within the Trello app. An export feature is available to all Trello users, which means they can have a copy of their board data outside of the app itself. But it is in JSON format only. This format does not commonly load into spreadsheet programs like Excel. A long way to go about this is to find a tool that converts data from JSON into CSV format. Data in CSV can then be imported to Excel.
The problem with this approach is that each conversion using a different tool may introduce inaccuracies and error in the data. Another problem is the time delay. A large data needs a powerful computer to generate the reports and render the charts. Furthermore, by the time the data is on Excel, it may already be old. Excel is a good spreadsheet application, but it is not built for collaboration. To share it with others means to produce multiple copies that will be sent electronically or printed manually. Eventually, copies may become different from the original. There is also the problem of accessibility. Only those who own a copy are the only ones who can see.
Introducing Bridge24
Then there is the Bridge24 solution. Bridge24 for Trello provides enhanced reporting and exporting capabilities in an easy online solution. It seamlessly integrates and dynamically connects with Trello in a few clicks. Whatever data users are working on Bridge24 is the same data on Trello, with two-way sync in real time. Therefore, everyone is looking at a single updated source of truth. As an online tool, it is highly accessible to everyone with an Internet connection.
Interactive Charts
Bridge24 for Trello includes interactive charts that provide users a visual representation of the distribution of their cards. Instead of looking at lists after lists of cards, or performing extensive filtering, they can simply look at graphical information in relation to the whole or with other project items. Charts instantly reflect data based on which cards are currently displayed from the board, or as a result of a filter. For instance, clicking on the chart legend will instantly display/hide the associated data. Thus, they are able to find relevant information quickly using a flexible and easy-to-use tool.
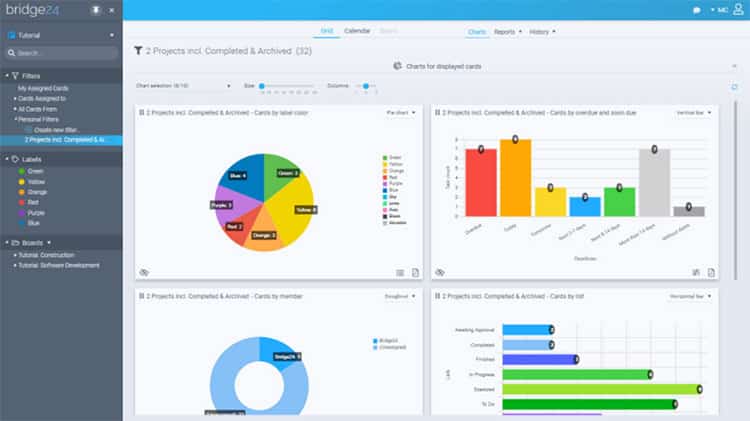
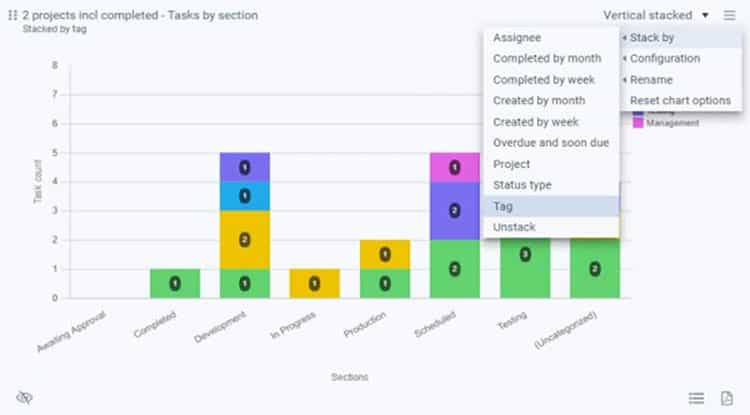
Moreover, users can choose from several types of charts that can best represent the cards or tasks in the project. Options are pie chart, doughnut, polar, horizontal bar, or vertical bar. And if a single chart is not enough, as when looking for more details or making comparisons, users can stack charts to display 2 variables in the same chart. As an example, a chart can be generated to display all tasks by project. Then, in the same chart, stack the chart by displaying the data by assignee. The option to sort the order of the data displayed in the charts is also possible.
The flexibility of the interactive charts in Bridge24 includes not only the resulting display, but also the selection of the data to be displayed. It can automatically create (predefined) charts by board member, status type, list, label color, label name, created by week, and more. It can create charts also by completion status and archived status. Users can use filters, such as filter by deadline, to quickly view a group of cards. Going from graphical to details is done just by clicking any segment of the chart to access the associated card list. Clicking an item in the list will open the card for editing. Also, users can easily export the chart and card list to PDF format.
Advanced Reports
Bridge24 for Trello is a powerful reporting tool through its available views. It has a Grid view, a Calendar view, and its own flexible Kanban board view. But what is notable here is that using a single tool, individuals and teams now have access to a variety of reports without having to worry about using separate multiple tools and doing several format conversions just to look at their Trello project data. They can easily export in Excel or PDF format.
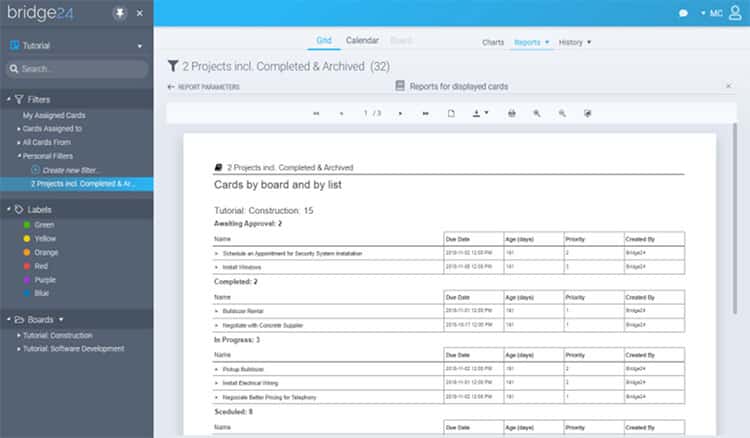
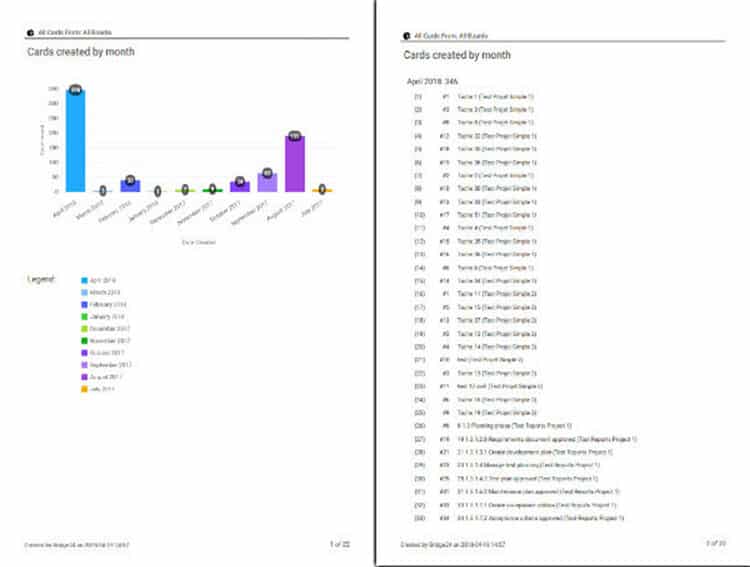
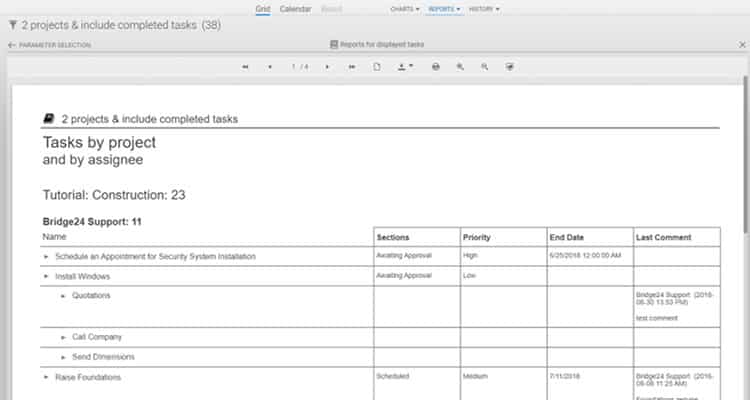
The Advanced Reports features include predefined reports based on filtered cards in a high-quality printable format. Users can add 2 level grouping when creating reports; for example, grouping tasks by project and by assignee. They can add 4 additional fields to the default output for greater context. Reports can also include checklists found inside the cards.
The Bridge24 Advantage
Bridge24 is more than a reporting and exporting tool. It has other features that allow users of popular productivity apps like Trello, Asana, Basecamp, and AceProject to expand and enhance the features of their original project management tools. It fills certain feature gaps present in these project management tools because of different priorities and/or market direction. For example, Bridge24 for Trello perhaps may be the only one supporting the export of custom fields and comments data. It also exports card history to Excel for a date range and specific users. To learn more and experience all its features, try Bridge24 now for free.
Have you read?
# GDP Rankings Of The World’s Largest Economies, 2019.
# Most Expensive Countries In The World To Live In, 2019.
# Countries With The Highest Average Life Expectancies In 2030.
# The World’s Best Performing Companies 2019.
# World’s Most Luxurious Hotels, 2019.
Add CEOWORLD magazine to your Google News feed.
Follow CEOWORLD magazine headlines on: Google News, LinkedIn, Twitter, and Facebook.
This report/news/ranking/statistics has been prepared only for general guidance on matters of interest and does not constitute professional advice. You should not act upon the information contained in this publication without obtaining specific professional advice. No representation or warranty (express or implied) is given as to the accuracy or completeness of the information contained in this publication, and, to the extent permitted by law, CEOWORLD magazine does not accept or assume any liability, responsibility or duty of care for any consequences of you or anyone else acting, or refraining to act, in reliance on the information contained in this publication or for any decision based on it.
Copyright 2024 The CEOWORLD magazine. All rights reserved. This material (and any extract from it) must not be copied, redistributed or placed on any website, without CEOWORLD magazine' prior written consent. For media queries, please contact: info@ceoworld.biz
SUBSCRIBE NEWSLETTER