
Navigating Chaos: Discover the 10 Cities Struggling with Extreme Traffic Jams
Motorists globally have left the pandemic in the rearview mirror and returned to the roads, marking a renewed era of traffic challenges for numerous cities worldwide.
In assessing the severity of traffic congestion, we examined the annual Global Traffic Scorecard from INRIX, a global transportation analytics company.
Our ranking considered the cities with the highest hours lost per driver in 2022 due to traffic congestion. Additionally, we scrutinized data on the last mile’s average speed—a key metric indicating the average speed during the final mile of a trip within a specific city.
Each of the ten cities on our list experienced a minimum of 105 lost hours per driver in the past year, equivalent to over four full days spent navigating through traffic. Notably, Paris was the sole city reporting a decrease in traffic congestion compared to 2021.
Among the ten cities witnessing a surge in traffic challenges from 2021, four were in the U.S.—Boston, grappling with a 72% increase in hours lost; Miami, facing a 59% rise in traffic-related time loss; Chicago, with a 49% uptick; and New York, where drivers spent 15% more time in traffic. Monterrey in Mexico, Miami, Toronto in Canada, and Boston exhibited the most significant leaps in rankings from 2021 to 2022, none of which had been in the top 10 the previous year.
Comparing the current scenario to the pre-COVID-19 era, six cities reported a reduction in lost hours, with Bogota, Colombia, leading the pack with a remarkable 36% decrease.
In contrast, Monterrey experienced a 108% spike in time lost to traffic compared to pre-pandemic levels. Miami, undergoing a 30% increase in traffic-related time loss, reflected the impact of a surging population in Florida.
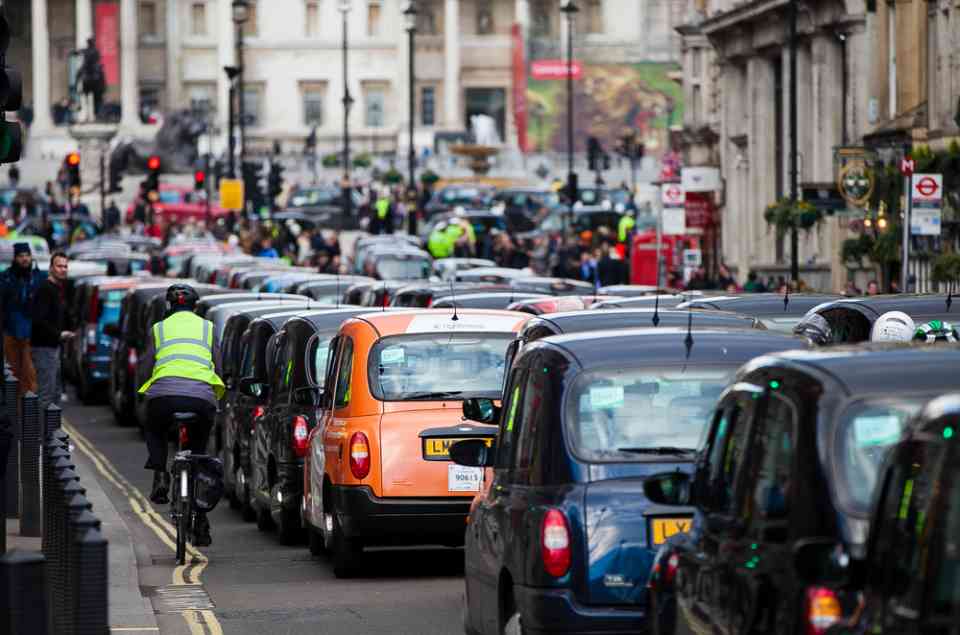
London, maintaining its status as the most congested city for the second consecutive year, has taken steps to alleviate traffic pressure through the implementation of congestion pricing. Motorists driving in central London during specified hours must prepay a daily Congestion Charge of £15 ($18.57) as part of the city’s efforts to manage congestion.
Presenting here a list of the world’s most congested cities:
- London, United Kingdom
Time lost due to traffic congestion per driver (2022): 156 hours
Change in time lost from 2021: 5%
Change in time lost from pre-Covid: 5%
Average speed of the last mile of each trip in the city: 10 MPH
Change in last mile average speed from 2021: -1 MPH - Chicago, Illinois
Time lost due to traffic congestion per driver (2022): 155 hours
Change in time lost from 2021: 49%
Change in time lost from pre-Covid: 7%
Average speed of the last mile of each trip in the city: 11 MPH
Change in last mile average speed from 2021: -4 MPH - Paris, France
Time lost due to traffic congestion per driver (2022): 138 hours
Change in time lost from 2021: -1%
Change in time lost from pre-Covid: -16%
Average speed of the last mile of each trip in the city: 11 MPH
Change in last mile average speed from 2021: 0 MPH - Boston, Massachusetts
Time lost due to traffic congestion per driver (2022): 134 hours
Change in time lost from 2021: 72%
Change in time lost from pre-Covid: -10%
Average speed of the last mile of each trip in the city: 11 MPH
Change in last mile average speed from 2021: -4 MPH - Bogota, Colombia
Time lost due to trafic congestion per driver (2022): 122 hours
Change in time lost from 2021: 30%
Change in time lost from pre-Covid: -36%
Average speed of the last mile of each trip in the city: 11 MPH
Change in last mile average speed from 2021: -2 MPH - Palermo, Italy
Time lost due to traffic congestion per driver (2022): 121 hours
Change in time lost from 2021: 11%
Change in time lost from pre-Covid: -12%
Average speed of the last mile of each trip in the city: 9 MPH
Change in last mile average speed from 2021: 0 MPH - Toronto, Canada
Time lost due to traffic congestion per driver (2022): 118 hours
Change in time lost from 2021: 59%
Change in time lost from pre-Covid: -13%
Average speed of the last mile of each trip in the city: 10 MPH
Change in last mile average speed from 2021: -4 MPH - New York City, New York
Time lost due to traffic congestion per driver (2022): 117 hours
Change in time lost from 2021: 15%
Change in time lost from pre-Covid: -16%
Average speed of the last mile of each trip in the city: 11 MPH
Change in last mile average speed from 2021: -2 MPH - Monterrey, Mexico
Time lost due to traffic congestion per driver (2022): 116 hours
Change in time lost from 2021: 66%
Change in time lost from pre-Covid: 108%
Average speed of the last mile of each trip in the city: 19 MPH
Change in last mile average speed from 2021: -4 MPH - Miami, Florida
Time lost due to traffic congestion per driver (2022): 105 hours
Change in time lost from 2021: 59%
Change in time lost from pre-Covid: 30%
Average speed of the last mile of each trip in the city: 15 MPH
Change in last mile average speed from 2021: -4 MPH
Have you read?
Biggest banks in the world, as measured by total assets, 2023.
Highest-paid CEOs among Russell 3000 companies, 2023.
These Are the highest-paid CEOs among S&P 500 companies, 2023.
Ranked: The 50 Richest Celebrity Couples in the World, 2023.
The world’s wealthiest 300 cities, 2023.
Global Happiness Index: Happiest Countries In The World In 2023.
Add CEOWORLD magazine to your Google News feed.
Follow CEOWORLD magazine headlines on: Google News, LinkedIn, Twitter, and Facebook.
Copyright 2024 The CEOWORLD magazine. All rights reserved. This material (and any extract from it) must not be copied, redistributed or placed on any website, without CEOWORLD magazine' prior written consent. For media queries, please contact: info@ceoworld.biz