America’s Deadliest Professions: A Look at the Most Dangerous Jobs in the US
According to the U.S. Bureau of Labor Statistics, fallers in the logging industry faced an astonishingly high fatal work injury rate of 530 per 100,000 workers in the past year. This rate, derived from 33 worker deaths among approximately 5,600, starkly contrasts with the national average fatality rate of 3.3 deaths per 100,000 workers across all tracked occupations by the U.S. Department of Labor.
However, the peril extends beyond fallers, encompassing a spectrum of hazardous occupations in logging, forestry, and tree-trimming, where tens of thousands of workers undertake some of the riskiest work in the nation. In our analysis of the 2021 Census of Fatal Occupational Injuries from the BLS, we unveil the deadliest jobs in the U.S., ranking occupations based on the highest annual fatal injuries per 100,000 workers.
Notably, high-risk professions include commercial divers, industrial fishers, and various blue-collar roles in the country’s oil and gas fields. The list also sheds light on lower-paying occupations like taxi drivers, tree pruners, roofers, as well as jobs in mechanical trades such as farm equipment mechanics, power-line installers, and elevator repairers.
- Fallers
Fatal work injury rate: 589.3 per 100,000
Fatal work injuries: 33
Common cause of fatal injury: Contact with machinery or objects (e.g., logs)
Non-fatal injuries: 40 (714.3 per 100,000)
Total employed: 5,600 - Commercial Divers
Fatal work injury rate: 233.3 per 100,000
Fatal work injuries: 7
Common cause of fatal injury: Equipment failure
Non-fatal injuries: Not available
Total employed: 3,000 - Commercial Pilots
Fatal work injury rate: 123.7 per 100,000
Fatal work injuries: 59
Common cause of fatal injury: Crashes
Non-fatal injuries: 190 (398.3 per 100,000)
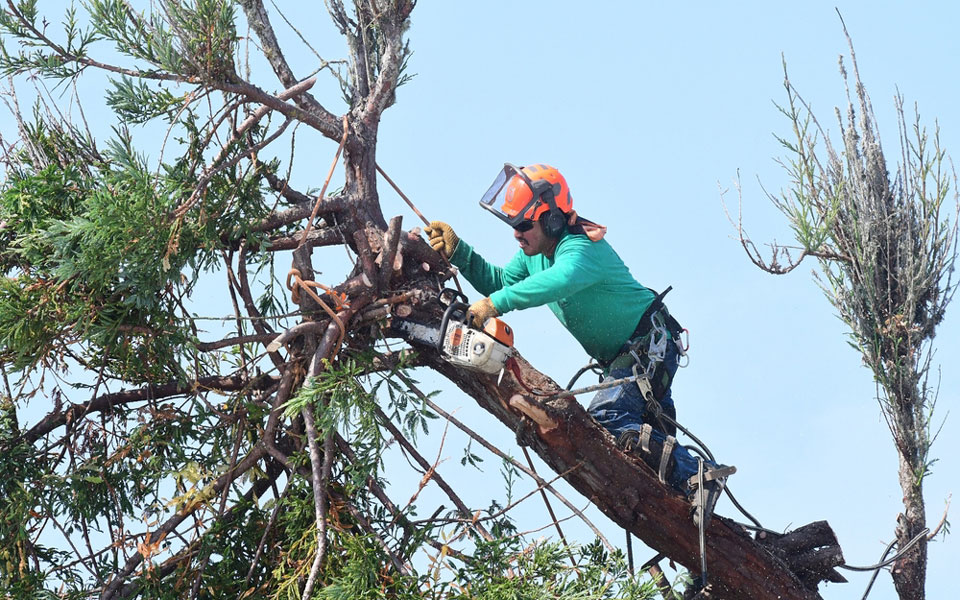
Total employed: 47,700 - Tree Trimmers and Pruners
Fatal work injury rate: 122.4 per 100,000
Fatal work injuries: 78
Common cause of fatal injury: Falls, slips, trips
Non-fatal injuries: 840 (1,318.7 per 100,000)
Total employed: 63,700 - Extraction Worker Helpers
Fatal work injury rate: 80.6 per 100,000
Fatal work injuries: 5
Common cause of fatal injury: Transportation incidents
Non-fatal injuries: 20 (322.6 per 100,000)
Total employed: 6,200 - Roofers
Fatal work injury rate: 72.4 per 100,000
Fatal work injuries: 115
Common cause of fatal injury: Falls, slips, trips
Non-fatal injuries: 1,960 (1,234.3 per 100,000)
Total employed: 158,800 - Earth Drillers, Except Oil and Gas
Fatal work injury rate: 42.9 per 100,000
Fatal work injuries: 7
Common cause of fatal injury: Contact with objects and equipment
Non-fatal injuries: 240 (1,472.4 per 100,000)
Total employed: 16,300 - Heavy and Tractor-Trailer Truck Drivers
Fatal work injury rate: 41.7 per 100,000
Fatal work injuries: 874
Common cause of fatal injury: Transportation incidents
Non-fatal injuries: 43,500 (2,076.7 per 100,000)
Total employed: 2,094,700 - Athletes and Sports Competitors
Fatal work injury rate: 38.0 per 100,000
Fatal work injuries: 6
Common cause of fatal injury: Sudden cardiac death
Non-fatal injuries: 920 (5,822.8 per 100,000)
Total employed: 15,800 - Sailors and Marine Oilers
Fatal work injury rate: 36.2 per 100,000
Fatal work injuries: 10
Common cause of fatal injury: Transportation incidents
Non-fatal injuries: 380 (1,376.8 per 100,000)
Total employed: 27,600 - First-Line Supervisors of Farming, Fishing, and Forestry Workers
Fatal work injury rate: 30.0 per 100,000
Fatal work injuries: 16
Common cause of fatal injury: Transportation incidents
Non-fatal injuries: 460 (863.0 per 100,000)
Total employed: 53,300 - Farm Equipment Mechanics and Service Technicians
Fatal work injury rate: 28.3 per 100,000
Fatal work injuries: 14
Common cause of fatal injury: Contact with objects and equipment
Non-fatal injuries: 660 (1,333.3 per 100,000)
Total employed: 49,500 - Wellhead Pumpers
Fatal work injury rate: 27.8 per 100,000
Fatal work injuries: 5
Common cause of fatal injury: Electrocution, explosion
Non-fatal injuries: 20 (111.1 per 100,000)
Total employed: 18,000 - Electrical Power-Line Installers and Repairers
Fatal work injury rate: 23.7 per 100,000
Fatal work injuries: 30
Common cause of fatal injury: Exposure to harmful substances or environments
Non-fatal injuries: 1,910 (1,508.7 per 100,000)
Total employed: 126,600 - Taxi Drivers
Fatal work injury rate: 23.3 per 100,000
Fatal work injuries: 30
Common cause of fatal injury: Homicide
Non-fatal injuries: 260 (202.3 per 100,000)
Total employed: 128,500 - Audiovisual Equipment Installers and Repairers
Fatal work injury rate: 22.6 per 100,000
Fatal work injuries: 6
Common cause of fatal injury: Not available
Non-fatal injuries: 340 (1,278.2 per 100,000)
Total employed: 26,600 - Maintenance Workers, Machinery
Fatal work injury rate: 22.2 per 100,000
Fatal work injuries: 13
Common cause of fatal injury: Falls, slips, trips
Non-fatal injuries: 720 (1,230.8 per 100,000)
Total employed: 58,500 - Excavating and Loading Machine and Dragline Operators, Surface Mining
Fatal work injury rate: 21.9 per 100,000
Fatal work injuries: 8
Common cause of fatal injury: Contact with objects and equipment
Non-fatal injuries: 40 (109.6 per 100,000)
Total employed: 36,500 - Elevator and Escalator Installers and Repairers
Fatal work injury rate: 21.6 per 100,000
Fatal work injuries: 5
Common cause of fatal injury: Falls
Non-fatal injuries: 400 (1,724.1 per 100,000)
Total employed: 23,200 - Roustabouts, Oil and Gas
Fatal work injury rate: 21.4 per 100,000
Fatal work injuries: 8
Common cause of fatal injury: Transportation incidents
Non-fatal injuries: 520 (1,394.1 per 100,000)
Total employed: 37,300 - Structural Iron and Steel Workers
Fatal work injury rate: 20.3 per 100,000
Fatal work injuries: 14
Common cause of fatal injury: Falls, slips, trips
Non-fatal injuries: 780 (1,130.4 per 100,000)
Total employed: 69,000 - Farmworkers, Farm, Ranch, and Aquacultural Animals
Fatal work injury rate: 20.1 per 100,000
Fatal work injuries: 46
Common cause of fatal injury: Transportation incidents
Non-fatal injuries: 4,950 (2,166.3 per 100,000)
Total employed: 228,500 - Crane and Tower Operators
Fatal work injury rate: 20.0 per 100,000
Fatal work injuries: 9
Common cause of fatal injury: Contact with objects and equipment
Non-fatal injuries: 390 (864.7 per 100,000)
Total employed: 45,100
Have you read?
Countries With The Highest And Lowest Average Salaries, 2023.
Best Fashion Schools In The World.
Best Business Schools In The World.
The World’s Best CEOs And C-Suite Executives, 2023.
World’s Most Influential and Innovative Companies.
World’s Best Hospitality And Hotel Management Schools.
Add CEOWORLD magazine to your Google News feed.
Follow CEOWORLD magazine headlines on: Google News, LinkedIn, Twitter, and Facebook.
This report/news/ranking/statistics has been prepared only for general guidance on matters of interest and does not constitute professional advice. You should not act upon the information contained in this publication without obtaining specific professional advice. No representation or warranty (express or implied) is given as to the accuracy or completeness of the information contained in this publication, and, to the extent permitted by law, CEOWORLD magazine does not accept or assume any liability, responsibility or duty of care for any consequences of you or anyone else acting, or refraining to act, in reliance on the information contained in this publication or for any decision based on it.
Copyright 2024 The CEOWORLD magazine. All rights reserved. This material (and any extract from it) must not be copied, redistributed or placed on any website, without CEOWORLD magazine' prior written consent. For media queries, please contact: info@ceoworld.biz
SUBSCRIBE NEWSLETTER