
How can we measure the economic success of a country? A classic measure is GDP per capita, which shows individual economic prosperity. However, comparing countries solely based on this metric doesn’t give us the whole picture. This is because the cost of living and inflation rates can vary significantly between countries.
A better way to compare living standards across countries is by using Purchasing Power Parity (PPP) as it considers local costs and inflation rates. Some countries may have a higher GDP per capita due to being tax havens, which can be misleading. Hence, using GDP per capita PPP in the 2023 ranking can help us identify the poorest countries in the world more accurately. Therefore, these are the poorest countries in the world ranked by GDP per capita PPP. If you want to learn about the poorest countries in the world, you can refer to this report, which lists the countries with the lowest GDP per capita in 2024.
This method of measuring a country’s economic output, known as GDP per capita adjusted by purchasing power parity (PPP), allows for a more accurate comparison of living standards across different countries. By taking into account the fact that the value of a dollar can vary significantly between countries, we can see how countries perform differently based on this measure. Below, we provide an analysis of how different countries fare according to this metric.
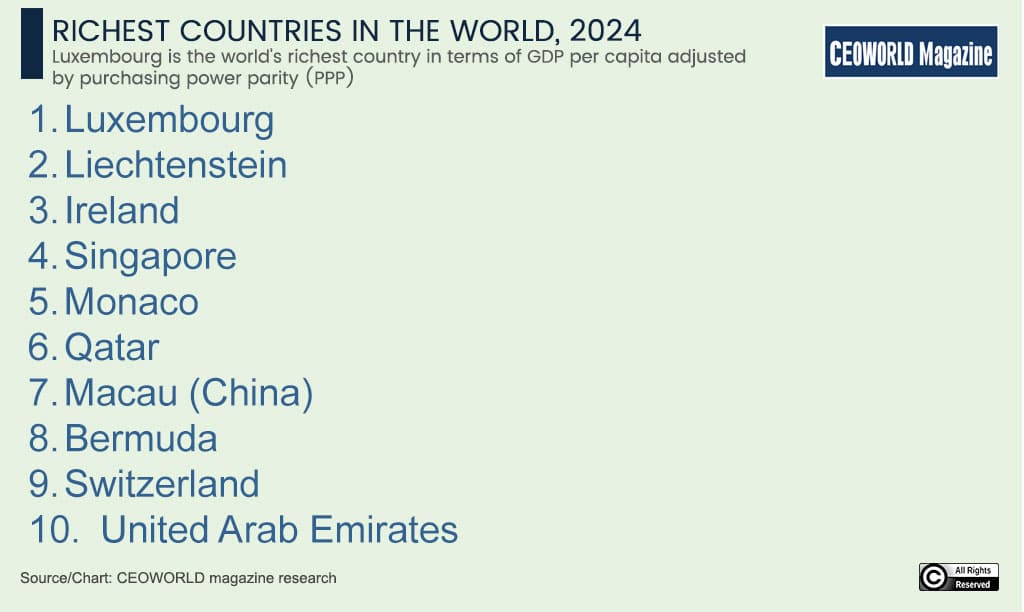
Luxembourg has a thriving financial sector that contributes to 25% of its GDP. It is also considered the world’s richest country in terms of GDP per capita adjusted by purchasing power parity (PPP). With a population of only 660,000 people, the nation is known for its favorable tax policies that attract foreign investment, making it a tax haven. Meanwhile, Singapore takes the title of the richest country in Asia, with a GDP per capita of $133,108. This is due to its global role in finance, trade, and tourism.
Richest Countries In The World, 2024
| Rank | Country | Region | GDP (PPP) per capita | GDP (PPP) | GDP (nominal) per capita | GDP (nominal) |
|---|---|---|---|---|---|---|
| 1 | Luxembourg | Europe | 143,304 | 94,152 | 135,605 | 89,095 |
| 2 | Liechtenstein | Europe | 139,100 | 4,978 | 184,083 | 6608 |
| 3 | Ireland | Europe | 137,638 | 722,929 | 112,248 | 589,569 |
| 4 | Singapore | Asia | 133,108 | 786,870 | 87,884 | 497,347 |
| 5 | Monaco | Europe | 115,700 | 7,672 | 234,317 | 8596 |
| 6 | Qatar | Asia | 114,210 | 328,134 | 81,968 | 235,500 |
| 7 | Macau (China) | Asia | 98,157 | 69,565 | 54,296 | 38,480 |
| 8 | Bermuda | Americas | 95,837 | 5,441 | 118,846 | 7551 |
| 9 | Switzerland | Europe | 89,537 | 788,335 | 102,865 | 905,684 |
| 10 | United Arab Emirates | Asia | 88,962 | 895,166 | 50,602 | 509,179 |
| 11 | San Marino | Europe | 84,135 | 2,872 | 58,541 | 1,998 |
| 12 | Norway | Europe | 82,236 | 452,964 | 99,266 | 546,768 |
| 13 | United States | Americas | 80,412 | 27,970,000 | 80,412 | 26,949,643 |
| 14 | Denmark | Europe | 74,958 | 441,754 | 71,402 | 420,800 |
| 15 | Cayman Islands | Americas | 74,155 | 4,763 | 88,476 | 5809 |
| 16 | Netherlands | Europe | 73,317 | 1,297,024 | 61,770 | 1,092,748 |
| 17 | Hong Kong (China) | Asia | 72,861 | 548,999 | 51,168 | 385,546 |
| 18 | Brunei | Asia | 72,610 | 32,000 | 34,384 | 15,153 |
| 19 | Taiwan | Asia | 72,485 | 1,685,358 | 32,339 | 751,930 |
| 20 | Iceland | Europe | 69,833 | 27,078 | 78,837 | 30,570 |
| 21 | Austria | Europe | 69,069 | 626,458 | 58,013 | 526,182 |
| 22 | Saudi Arabia | Asia | 68,453 | 2,390,000 | 32,586 | 1,069,437 |
| 23 | Andorra | Europe | 68,232 | 5,711 | 44,107 | 3,692 |
| 24 | Sweden | Europe | 66,209 | 715,995 | 55,216 | 597,110 |
| 25 | Germany | Europe | 66,038 | 5,720,000 | 52,824 | 4,429,838 |
| 26 | Belgium | Europe | 65,813 | 769,682 | 53,657 | 627,511 |
| 27 | Australia | Oceania | 64,675 | 1,780,000 | 63,487 | 1,687,713 |
| 28 | Malta | Europe | 63,481 | 33,303 | 38,715 | 20,311 |
| 29 | Guyana | Americas | 61,099 | 48,514 | 20,565 | 16,329 |
| 30 | Bahrain | Asia | 60,715 | 95,973 | 28,464 | 44,994 |
| 31 | Finland | Europe | 59,869 | 335,760 | 54,507 | 305,689 |
| 32 | Canada | Americas | 59,813 | 2,470,000 | 53,247 | 2,117,805 |
| 33 | France | Europe | 58,765 | 4,010,000 | 46,315 | 3,049,016 |
| 34 | United Kingdom | Europe | 56,836 | 3,980,000 | 48,912 | 3,332,059 |
| 35 | South Korea | Asia | 56,709 | 3,006,000 | 33,147 | 1,709,232 |
| 36 | Israel | Asia | 54,771 | 537,140 | 53,196 | 521,688 |
| 37 | Italy | Europe | 54,259 | 3,290,000 | 37,146 | 2,186,082 |
| 38 | Cyprus | Asia | 53,931 | 49,655 | 34,791 | 32,032 |
| 39 | New Zealand | Oceania | 53,809 | 279,183 | 48,072 | 249,415 |
| 40 | Japan | Asia | 52,120 | 6,710,000 | 33,950 | 4,230,862 |
| 41 | Kuwait | Asia | 51,765 | 256,593 | 32,215 | 159,687 |
| 42 | Slovenia | Europe | 51,407 | 108,683 | 32,350 | 68,394 |
| 43 | Aruba | Americas | 51,352 | 5,502 | 35,718 | 3,827 |
| 44 | Spain | Europe | 50,472 | 2,510,000 | 33,090 | 1,582,054 |
| 45 | Lithuania | Europe | 49,245 | 137,328 | 28,482 | 79,427 |
| 46 | Czech Republic | Europe | 49,025 | 539,318 | 30,475 | 335,243 |
| 47 | Poland | Europe | 45,538 | 1,712,629 | 22,393 | 842,172 |
| 48 | Estonia | Europe | 45,236 | 60,997 | 30,998 | 41,799 |
| 49 | Portugal | Europe | 45,227 | 465,131 | 26,879 | 276,432 |
| 50 | Bahamas | Americas | 44,950 | 18,146 | 34,371 | 13,876 |
| 51 | Hungary | Europe | 43,601 | 421,683 | 21,075 | 203,829 |
| 52 | Croatia | Europe | 42,873 | 164,672 | 20,877 | 80,185 |
| 53 | Panama | Americas | 42,738 | 190,306 | 18,493 | 82,348 |
| 54 | Slovakia | Europe | 42,228 | 229,584 | 24,471 | 133,044 |
| 55 | Turkey | Asia | 41,888 | 3,810,000 | 13,384 | 1,154,600 |
| 56 | Seychelles | Africa | 41,829 | 4,175 | 20,890 | 2,085 |
| 57 | Sint Maarten (Dutch part) | Americas | 41,812 | 1,471 | 36,220 | 1572 |
| 58 | Greenland | Americas | 41,800 | 2,413 | 57,116 | 3273 |
| 59 | Puerto Rico | Americas | 41,682 | 132,052 | 37,093 | 117,515 |
| 60 | Romania | Europe | 41,029 | 780,797 | 18,413 | 350,414 |
| 61 | Latvia | Europe | 40,892 | 76,550 | 24,929 | 46,668 |
| 62 | Greece | Europe | 39,864 | 416,969 | 23,173 | 242,385 |
| 63 | Oman | Asia | 39,336 | 200,295 | 21,266 | 108,282 |
| 64 | Maldives | Asia | 37,094 | 14,740 | 17,559 | 6,977 |
| 65 | Malaysia | Asia | 37,083 | 1,225,927 | 13,034 | 430,895 |
| 66 | Russia | Europe | 35,310 | 5,230,000 | 13,006 | 1,862,470 |
| 67 | British Virgin Islands | Americas | 34,200 | 500 | 49,444 | 1539 |
| 68 | Montserrat | Americas | 34,000 | 167 | 16,199 | 72 |
| 69 | Bulgaria | Europe | 33,780 | 216,499 | 16,087 | 103,099 |
| 70 | Kazakhstan | Asia | 32,712 | 654,050 | 12,968 | 259,292 |
| 71 | New Caledonia (France) | Oceania | 31,100 | 11,110 | 36,668 | 10071 |
| 72 | Trinidad and Tobago | Americas | 30,719 | 43,658 | 19,622 | 27,887 |
| 73 | Chile | Americas | 29,935 | 597,520 | 17,254 | 344,400 |
| 74 | Saint Kitts and Nevis | Americas | 29,893 | 1,760 | 18,158 | 1,069 |
| 75 | Mauritius | Africa | 29,349 | 37,012 | 11,752 | 14,819 |
| 76 | Uruguay | Americas | 28,984 | 103,372 | 21,378 | 76,244 |
| 77 | Montenegro | Europe | 28,002 | 17,431 | 11,338 | 7,058 |
| 78 | Costa Rica | Americas | 26,809 | 141,527 | 16,213 | 85,590 |
| 79 | Argentina | Americas | 26,506 | 1,239,515 | 13,297 | 621,833 |
| 80 | Serbia | Europe | 26,074 | 173,075 | 11,301 | 75,015 |
| 81 | Dominican Republic | Americas | 25,523 | 273,703 | 11,249 | 120,629 |
| 82 | Antigua and Barbuda | Americas | 25,449 | 2,601 | 19,068 | 1,949 |
| 83 | Mexico | Americas | 24,976 | 3,420,000 | 13,804 | 1,811,468 |
| 84 | Libya | Africa | 24,382 | 166,887 | 5,872 | 40,194 |
| 85 | Belarus | Europe | 24,017 | 221,186 | 7,477 | 68,864 |
| 86 | China | Asia | 23,309 | 35,004,000 | 12,541 | 17,700,899 |
| 87 | Turks and Caicos Islands | Americas | 22,915 | 918 | 20,177 | 1139 |
| 88 | Curacao | Americas | 22,832 | 3,205 | 17,718 | 2700 |
| 89 | Thailand | Asia | 22,491 | 1,578,452 | 7,298 | 512,193 |
| 90 | Georgia | Asia | 22,357 | 82,210 | 8,165 | 30,023 |
| 91 | North Macedonia | Europe | 21,391 | 44,055 | 7,672 | 15,801 |
| 92 | Grenada | Americas | 20,195 | 2,307 | 11,437 | 1,306 |
| 93 | Brazil | Americas | 20,079 | 4,260,000 | 10,413 | 2,126,809 |
| 94 | Iran | Asia | 19,942 | 1,810,000 | 4,234 | 366,438 |
| 95 | Turkmenistan | Asia | 19,939 | 126,132 | 12,934 | 81,822 |
| 96 | Armenia | Asia | 19,745 | 58,497 | 8,283 | 24,540 |
| 97 | Bosnia and Herzegovina | Europe | 19,634 | 68,012 | 7,778 | 26,945 |
| 98 | Albania | Europe | 19,566 | 55,928 | 8,057 | 23,032 |
| 99 | Colombia | Americas | 19,482 | 1,016,124 | 6,976 | 363,835 |
| 100 | Botswana | Africa | 19,394 | 51,886 | 7,758 | 20,756 |
| 101 | Gabon | Africa | 19,165 | 41,922 | 8,832 | 19,319 |
| 102 | Saint Lucia | Americas | 18,973 | 3,452 | 13,572 | 2,469 |
| 103 | Barbados | Americas | 18,738 | 5,436 | 21,442 | 6,220 |
| 104 | Azerbaijan | Asia | 18,694 | 192,146 | 7,530 | 77,392 |
| 105 | Equatorial Guinea | Africa | 18,362 | 28,356 | 6,502 | 10,041 |
| 106 | Suriname | Americas | 18,311 | 11,435 | 5,667 | 3,539 |
| 107 | Saint Vincent and the Grenadines | Americas | 17,840 | 1,980 | 9,360 | 1,039 |
| 108 | Egypt | Africa | 17,123 | 1,920,000 | 3,770 | 398,397 |
| 109 | French Polynesia | Oceania | 17,000 | 5,490 | 19,999 | 6055 |
| 110 | Moldova | Europe | 16,916 | 42,217 | 6,411 | 16,000 |
| 111 | Cook Islands | Oceania | 16,700 | 300 | 19,264 | 328 |
| 112 | Fiji | Oceania | 16,564 | 15,152 | 6,025 | 5,511 |
| 113 | South Africa | Africa | 16,211 | 997,444 | 6,191 | 380,906 |
| 114 | Peru | Americas | 15,894 | 548,465 | 7,669 | 264,636 |
| 115 | Indonesia | Asia | 15,834 | 4,720,000 | 5,109 | 1,417,387 |
| 116 | Kosovo | Europe | 15,767 | 27,918 | 5,912 | 10,469 |
| 117 | Paraguay | Americas | 15,533 | 117,349 | 5,843 | 44,142 |
| 118 | Palau | Oceania | 15,169 | 268 | 15,113 | 267 |
| 119 | Mongolia | Asia | 15,088 | 52,989 | 5,348 | 18,782 |
| 120 | Dominica | Americas | 14,348 | 1,069 | 9,356 | 697 |
| 121 | Ukraine | Europe | 14,304 | 474,773 | 5,225 | 173,413 |
| 122 | Bhutan | Asia | 14,297 | 10,969 | 3,500 | 2,686 |
| 123 | Vietnam | Asia | 14,285 | 1,434,211 | 4,316 | 433,356 |
| 124 | Sri Lanka | Asia | 14,267 | 319,523 | 3,342 | 74404 |
| 125 | Algeria | Africa | 13,682 | 628,990 | 4,875 | 224,107 |
| 126 | Ecuador | Americas | 13,285 | 242,579 | 6,500 | 118,686 |
| 127 | Tunisia | Africa | 13,249 | 162,097 | 4,191 | 51,271 |
| 128 | Jamaica | Americas | 12,995 | 35,690 | 6,831 | 18,761 |
| 129 | Jordan | Asia | 12,809 | 132,092 | 4,851 | 50,022 |
| 130 | Cuba | Americas | 12,300 | 137,000 | 56,495 | 633442 |
| 131 | Anguilla | Americas | 12,200 | 175 | 19,216 | 303 |
| 132 | Eswatini | Africa | 11,859 | 13,797 | 3,995 | 4,648 |
| 133 | Lebanon | Asia | 11,794 | 72,370 | 3,283 | 37945 |
| 134 | Iraq | Asia | 11,742 | 508,973 | 5,883 | 297,695 |
| 135 | El Salvador | Americas | 11,717 | 74,505 | 5,558 | 35,339 |
| 136 | Namibia | Africa | 11,603 | 30,663 | 4,786 | 12,647 |
| 137 | Philippines | Asia | 11,326 | 1,278,624 | 3,859 | 435,675 |
| 138 | Nauru | Oceania | 11,169 | 143 | 11,757 | 150 |
| 139 | Belize | Americas | 11,166 | 5,032 | 7,142 | 3,218 |
| 140 | Guatemala | Americas | 10,595 | 201,365 | 5,407 | 102,765 |
| 141 | Morocco | Africa | 10,408 | 385,337 | 3,980 | 147,343 |
| 142 | Bolivia | Americas | 10,340 | 125,428 | 3,858 | 46,796 |
| 143 | Uzbekistan | Asia | 10,316 | 371,646 | 2,509 | 90,392 |
| 144 | Cape Verde (Cabo Verde) | Africa | 9,909 | 5,717 | 4,503 | 2,598 |
| 145 | Laos | Asia | 9,787 | 74,205 | 1,879 | 14,244 |
| 146 | India | Asia | 9,183 | 14,260,000 | 2,612 | 3,732,224 |
| 147 | Bangladesh | Asia | 8,673 | 1,476,870 | 2,621 | 446,349 |
| 148 | Venezuela | Americas | 7,985 | 211,926 | 3,474 | 92,210 |
| 149 | Nicaragua | Americas | 7,642 | 51,022 | 2,599 | 17,353 |
| 150 | Mauritania | Africa | 7,542 | 33,414 | 2,338 | 10,357 |
| 151 | Honduras | Americas | 7,163 | 75,030 | 3,245 | 33,992 |
| 152 | Tonga | Oceania | 7,127 | 711 | 5,488 | 547 |
| 153 | Angola | Africa | 7,077 | 260,323 | 2,550 | 93,796 |
| 154 | Djibouti | Africa | 6,985 | 7,193 | 3,761 | 3,873 |
| 155 | Ivory Coast (Côte d'Ivoire) | Africa | 6,960 | 202,647 | 2,728 | 79,430 |
| 156 | Ghana | Africa | 6,905 | 227,189 | 2,329 | 76,628 |
| 157 | Pakistan | Asia | 6,773 | 1,568,427 | 1,471 | 340,636 |
| 158 | Palestine | Asia | 6,642 | 36,391 | 3,464 | 18,109 |
| 159 | Kenya | Africa | 6,577 | 338,964 | 2,188 | 112,749 |
| 160 | Samoa | Oceania | 6,544 | 1,325 | 4,638 | 939 |
| 161 | Kyrgyzstan | Asia | 6,438 | 44,623 | 1,830 | 12,681 |
| 162 | Syria | Asia | 6,374 | 50,280 | 537 | 19719 |
| 163 | Nigeria | Africa | 6,148 | 1,365,903 | 1,755 | 390,002 |
| 164 | Cambodia | Asia | 6,087 | 98,319 | 1,916 | 30,943 |
| 165 | Tuvalu | Oceania | 5,766 | 63 | 5,773 | 63 |
| 166 | Congo | Africa | 5,552 | 27,994 | 2,858 | 14,407 |
| 167 | Tajikistan | Asia | 5,361 | 53,679 | 1,180 | 11,816 |
| 168 | Myanmar | Asia | 5,124 | 277,767 | 1,381 | 74,861 |
| 169 | Nepal | Asia | 4,934 | 150,800 | 1,353 | 41,339 |
| 170 | Cameroon | Africa | 4,661 | 133,335 | 1,722 | 49,262 |
| 171 | Senegal | Africa | 4,325 | 78,547 | 1,715 | 31,141 |
| 172 | Benin | Africa | 4,305 | 59,241 | 1,449 | 19,940 |
| 173 | São Tomé and Príncipe | Africa | 4,147 | 962 | 2,905 | 674 |
| 174 | Zambia | Africa | 4,068 | 83,687 | 1,486 | 29,536 |
| 175 | Micronesia | Oceania | 3,922 | 413 | 4,358 | 458 |
| 176 | East Timor | Asia | 3,747 | 5,062 | 1,497 | 2,023 |
| 177 | Ethiopia | Africa | 3,719 | 393,297 | 1,473 | 155,804 |
| 178 | Sudan | Africa | 3,605 | 172,651 | 534 | 25,569 |
| 179 | Tanzania | Africa | 3,595 | 227,725 | 1,327 | 84,033 |
| 180 | Comoros | Africa | 3,464 | 3,432 | 1,377 | 1,364 |
| 181 | Papua New Guinea | Oceania | 3,403 | 41,785 | 2,581 | 31,692 |
| 182 | Guinea | Africa | 3,241 | 48,750 | 1,543 | 23,205 |
| 183 | Lesotho | Africa | 3,235 | 6,915 | 1,110 | 2,373 |
| 184 | Uganda | Africa | 3,222 | 145,157 | 1,163 | 52,390 |
| 185 | Haiti | Americas | 3,186 | 38,952 | 2,125 | 25,986 |
| 186 | Rwanda | Africa | 3,137 | 42,346 | 1,032 | 13,927 |
| 187 | Guinea Bissau | Africa | 3,088 | 5,981 | 1,028 | 1,991 |
| 188 | Vanuatu | Oceania | 2,940 | 981 | 3,492 | 1,166 |
| 189 | Gambia | Africa | 2,837 | 7,502 | 903 | 2,388 |
| 190 | Togo | Africa | 2,768 | 25,103 | 1,004 | 9,111 |
| 191 | Zimbabwe | Africa | 2,750 | 44,448 | 2,006 | 32,424 |
| 192 | Burkina Faso | Africa | 2,683 | 62,788 | 888 | 20,785 |
| 193 | Mali | Africa | 2,639 | 61,625 | 913 | 21,309 |
| 194 | Solomon Islands | Oceania | 2,411 | 1,783 | 2,285 | 1,690 |
| 195 | Kiribati | Oceania | 2,381 | 297 | 1,968 | 246 |
| 196 | Sierra Leone | Africa | 2,097 | 17,784 | 415 | 3,519 |
| 197 | Yemen | Asia | 2,053 | 69,963 | 618 | 21,045 |
| 198 | Somalia | Africa | 1,998 | 32,078 | 717 | 11,515 |
| 199 | Afghanistan | Asia | 1,991 | 80,912 | 443 | 14,939 |
| 200 | Madagascar | Africa | 1,907 | 56,754 | 530 | 15,763 |
| 201 | Chad | Africa | 1,807 | 32,375 | 703 | 12,596 |
| 202 | Liberia | Africa | 1,789 | 9,718 | 800 | 4,347 |
| 203 | North Korea | Asia | 1,700 | 40,000 | 654 | 16750 |
| 204 | Malawi | Africa | 1,668 | 37,919 | 580 | 13,176 |
| 205 | Eritrea | Africa | 1,629 | 5224 | 644 | 2255 |
| 206 | Mozambique | Africa | 1,584 | 53,710 | 647 | 21,936 |
| 207 | Niger | Africa | 1,579 | 42,739 | 631 | 17,073 |
| 208 | DR Congo | Africa | 1,510 | 150,883 | 675 | 67,512 |
| 209 | Central African Republic | Africa | 1,109 | 5,678 | 539 | 2,760 |
| 210 | Burundi | Africa | 890 | 11,551 | 246 | 3,190 |
| 211 | South Sudan | Africa | 476 | 7,143 | 417 | 6,267 |
Have you read?
Revealed: Safest Cities in the World, 2024.
Ranked: These are the countries with the highest (and lowest) Home Ownership Rates, 2024.
Revealed: Largest Universities In The World By Number of Students Enrollment, 2024.
Report: Cities and Countries That Require Visitors to Pay Tourist Taxes, 2024.
Most-followed NFL players by team on Instagram, 2024.
Add CEOWORLD magazine to your Google News feed.
Follow CEOWORLD magazine headlines on: Google News, LinkedIn, Twitter, and Facebook.
This report/news/ranking/statistics has been prepared only for general guidance on matters of interest and does not constitute professional advice. You should not act upon the information contained in this publication without obtaining specific professional advice. No representation or warranty (express or implied) is given as to the accuracy or completeness of the information contained in this publication, and, to the extent permitted by law, CEOWORLD magazine does not accept or assume any liability, responsibility or duty of care for any consequences of you or anyone else acting, or refraining to act, in reliance on the information contained in this publication or for any decision based on it.
Copyright 2024 The CEOWORLD magazine. All rights reserved. This material (and any extract from it) must not be copied, redistributed or placed on any website, without CEOWORLD magazine' prior written consent. For media queries, please contact: info@ceoworld.biz
SUBSCRIBE NEWSLETTER