How IT Experience Data Drives Improvement

In the Digital Age, businesses run on technology, especially information technology (IT), we’re always looking to find areas for improvement and increased efficiency. How do we find them? One way – the way IT has done it historically – is to wait for a complaint or request from someone connected with the line of business involved. This approach frequently winds up being hit-or-miss and line-of-business specific, with various departments buying similar tools. This approach sometimes breeds improvement ‘projects’ that duplicate effort and cost, consume time and resources, and may or may not produce the desired results.
A better way is to go directly to those involved in the work. In the Lean approach, this is called the Gemba Walk and is aimed specifically at finding waste. While eliminating waste and finding efficiencies is important, improvement means adding positive elements as well as eliminating negative ones. In the realm of technology, this may mean upgrading, replacing, or finding new uses for the technologies we already own.
While an actual Gemba Walk will work when managers are physically located in the same place as workers and the work is literally visible, in the age of remote work and distributed teams, that is less and less possible. What is needed is a digital way to see what is affecting the work, slowing it, and creating inefficiencies.
Gathering, analyzing, sharing, and acting on data collected directly from the end-users of your company’s technology tools can drive improvement that really makes a difference in several ways:
- In the middle of a large shift in the relationship between companies and employees, finding specific technologies, applications, and processes that are frustrating employees can help improve morale and retention. Employees feel that they’re being heard and that their concerns are getting attention.
- Like the Gemba Walk, employee experience data points out delays and constraints that hold back work. How long are employees unproductive when they’ve asked for support on a particular malfunction on their computer or elsewhere in the IT ecosystem? They’ll tell you if you ask, and our latest data, based on over 445,000 responses, tells us that overall happiness with IT support for remote work has improved, for example, and that lost time has decreased.
- When 29% of end-users tell you (as they have) that, when getting IT support, one negative factor is that they were asked the same questions multiple times, you can consider changing the way end-users are identified when working with the support team, and how the support team uses the information they already have, to make the process both faster and friendlier. Support staff can be coached to read notes carefully and use the information already provided in each case, minimizing or eliminating duplicate questions and expediting the handling of each case.
- When you uncover which support channels end-users like and which they don’t, you can act to make your user interface (UI) and other improvements that increase both efficiency and effectiveness as well as saving time and costs. According to our most recent Happiness Score™ data, for example, IT portals are being rated much better now than they have been in the past.
- Because this data includes employee reports on lost time, you can see how interruptions in IT services affect productivity directly, possibly causing delays throughout the organization. Please note that lost time reported by employees is not the same as downtime, which is the time that specific IT services or devices are unavailable.
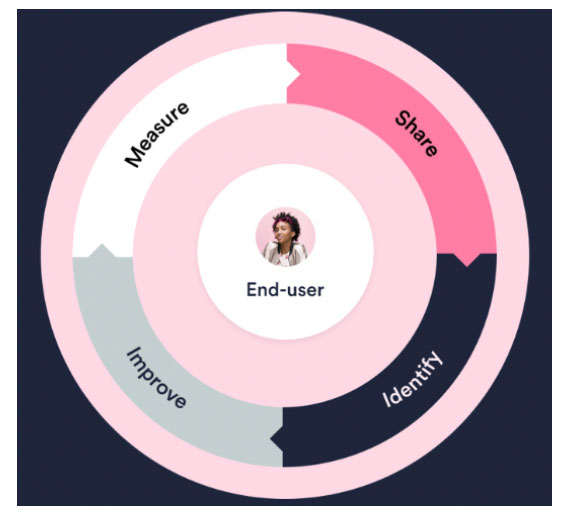
Throughout the course of our work, we’ve found that there are four key elements included in this approach to improvement:
- Measure – establish an experience baseline
- Share – make everything visible to all the stakeholders directly from the tool
- Identify – find areas or items that need attention and will have positive effects
- Improve – make changes based on the data
Now you’ll have the basis for a continuous improvement cycle – we call it the ITXM™ Framework – that is data-driven and is founded upon the experiences of end-users who are, after all, your employees.
Improvements can and should be done iteratively, sharing the data from each step before taking the next.
One of the most frequently used words in business right now is agility, the ability to adjust and respond quickly to changes. The Agile and DevOps approaches are being used across the enterprise and the IT framework ITIL®4 likewise contains guidance to “progress iteratively with feedback.”
Using experience data to drive improvement in this way can accelerate positive change, reduce unnecessary effort and expense, and assist in making employees feel heard and valued. There’s another effect as well: as improvements happen and take effect, IT is also demonstrating its value to the organization as a whole, something many CIOs struggle to accomplish.
Written by Sami Kallio.
Have you read?
Four Advanced Skills for Conflict Resolution and Motivating Others by Stephen McGarvey.
3 Strategies for Working Natural Language Processing Into Your Operations by Rhett Power.
Amazon’s new retail business model: customers win, competitors lose, and sellers pay to play by Robin Gaster Ph.D.
Why Your Diversity, Equity and Inclusion (DEI) Initiative Isn’t Moving the Needle – And Ways to Spur Movement by James T. McKim.
CEO Spotlight: Mark Hauser Details How Private Equity Transactions Work.
The Best Tech CEOs – Tough, without Acting Tough by Pete Devenyi.
Bring the best of the CEOWORLD magazine's global journalism to audiences in the United States and around the world. - Add CEOWORLD magazine to your Google News feed.
Follow CEOWORLD magazine headlines on: Google News, LinkedIn, Twitter, and Facebook.
Copyright 2025 The CEOWORLD magazine. All rights reserved. This material (and any extract from it) must not be copied, redistributed or placed on any website, without CEOWORLD magazine' prior written consent. For media queries, please contact: info@ceoworld.biz


