The Number Of Unemployed People In The United Kingdom (From 1976 To 2018)

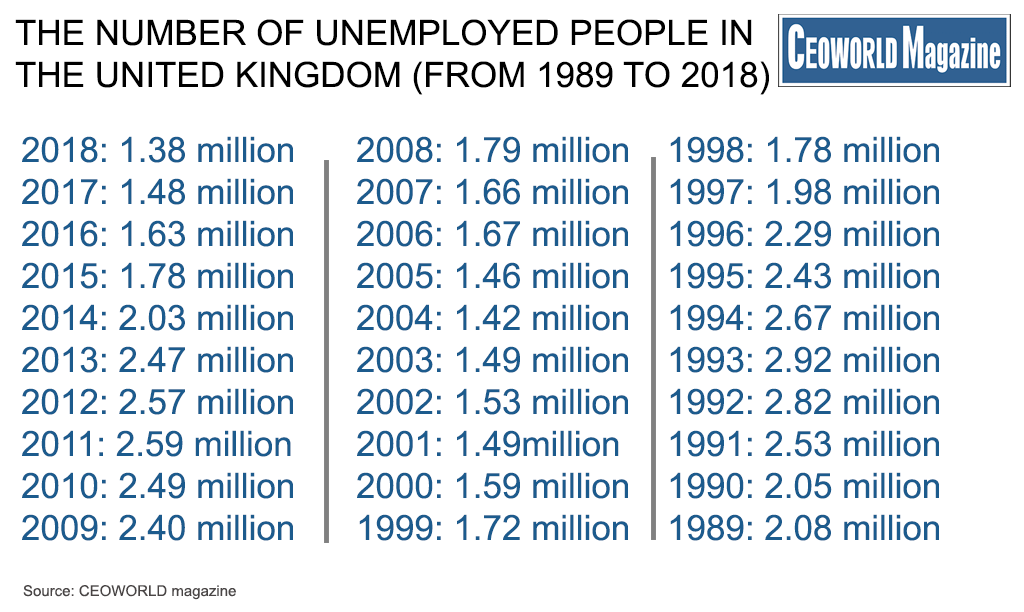
Despite weakening economic growth and Brexit clouds, the labour market in the United Kingdom boomed – the total number of unemployed people slid to 1.38 million in 2018, which was 100,000 lower than a year ago. To identify the number of unemployed people in the United Kingdom from 1976 to 2018, CEOWORLD magazine reviewed data from the Office for National Statistics (UK). The statistic below shows the unemployment figure for the United Kingdom from 1976 to 2018.
The number of people unemployed during this period has fluctuated from a high of 3.24 million people in 1984 to a low of 1.38 million people in 2018. The high unemployment figures recorded between 2009 and 2013 happened during the great recession when the UK’s gross domestic product (GDP) contracted by 4.2% between 2008 and 2009.
The Number Of Unemployed People In The United Kingdom (From 1976 To 2018)
- 2018: 1.38 million
- 2017: 1.48 million
- 2016: 1.63 million
- 2015: 1.78 million
- 2014: 2.03 million
- 2013: 2.47 million
- 2012: 2.57 million
- 2011: 2.59 million
- 2010: 2.49 million
- 2009: 2.40 million
- 2008: 1.79 million
- 2007: 1.66 million
- 2006: 1.67 million
- 2005: 1.46 million
- 2004: 1.42 million
- 2003: 1.49 million
- 2002: 1.53 million
- 2001: 1.49million
- 2000: 1.59 million
- 1999: 1.72 million
- 1998: 1.78 million
- 1997: 1.98 million
- 1996: 2.29 million
- 1995: 2.43 million
- 1994: 2.67 million
- 1993: 2.92 million
- 1992: 2.82 million
- 1991: 2.53 million
- 1990: 2.05 million
- 1989: 2.08 million
- 1988: 2.44 million
- 1987: 2.94 million
- 1986: 3.16 million
- 1985: 3.15 million
- 1984: 3.24 million
- 1983: 3.08 million
- 1982: 2.87 million
- 1981: 2.60 million
- 1980: 1.83 million
- 1979: 1.43 million
- 1978: 1.45 million
- 1977: 1.47 million
- 1976: 1.41 million

Gross domestic product (GDP) year-on-year growth in the United Kingdom from 2000 to 2018:
The data below shows the gross domestic product annual growth rate of the United Kingdom (UK) from 2000 to 2018. Since 2014, however, the UK’s GDP growth rate has slowed, growing by only 1.4 percent in 2018.
- 2018: 1.4%
- 2017: 1.8%
- 2016: 1.9%
- 2015: 2.3%
- 2014: 3.1%
- 2013: 2.1%
- 2012: 1.5%
- 2011: 1.5%
- 2010: 1.7%
- 2009: -4.2%
- 2008: -0.5%
- 2007: 2.4%
- 2006: 2.5%
- 2005: 3.1%
- 2004: 2.4%
- 2003: 3.3%
- 2002: 2.5%
- 2001: 2.5%
- 2000: 3.7%
Have you read?
# Revealed: Top Rated Visitor Attractions In Every Country In The World.
# The World’s Safest Cities Ranking, 2018.
# The World’s Most Powerful Militaries In 2018.
# The World’s Most (And Least) Expensive Cities For Taxis, 2018.
Bring the best of the CEOWORLD magazine's global journalism to audiences in the United States and around the world. - Add CEOWORLD magazine to your Google News feed.
Follow CEOWORLD magazine headlines on: Google News, LinkedIn, Twitter, and Facebook.
Copyright 2025 The CEOWORLD magazine. All rights reserved. This material (and any extract from it) must not be copied, redistributed or placed on any website, without CEOWORLD magazine' prior written consent. For media queries, please contact: info@ceoworld.biz


