6 Powerful Charts Prove Why The World is Better Than You Think

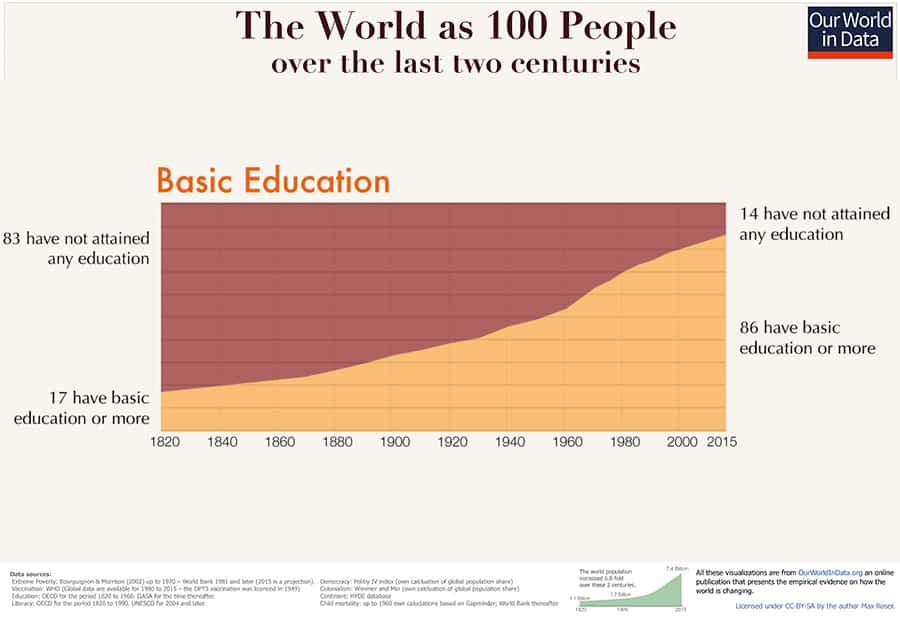
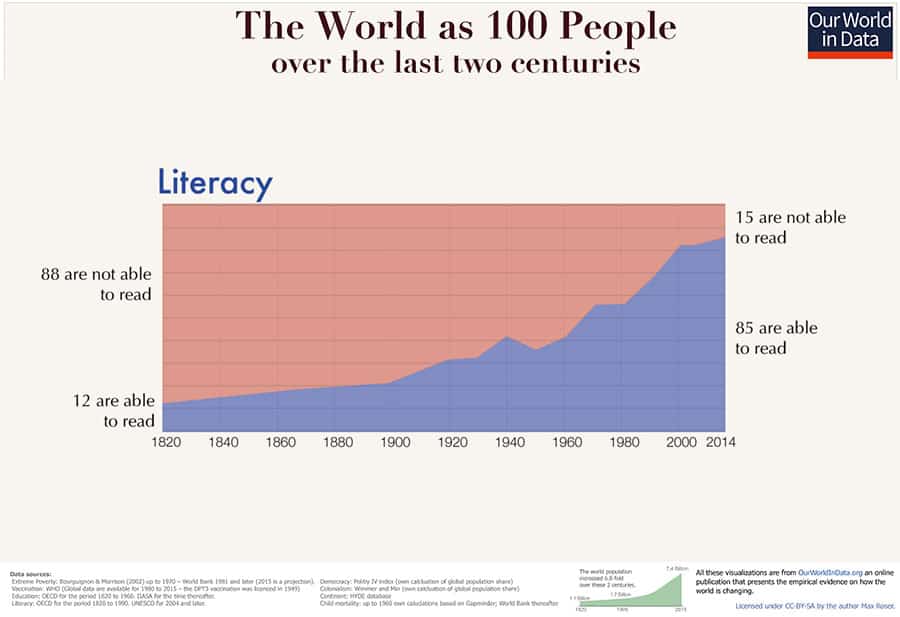
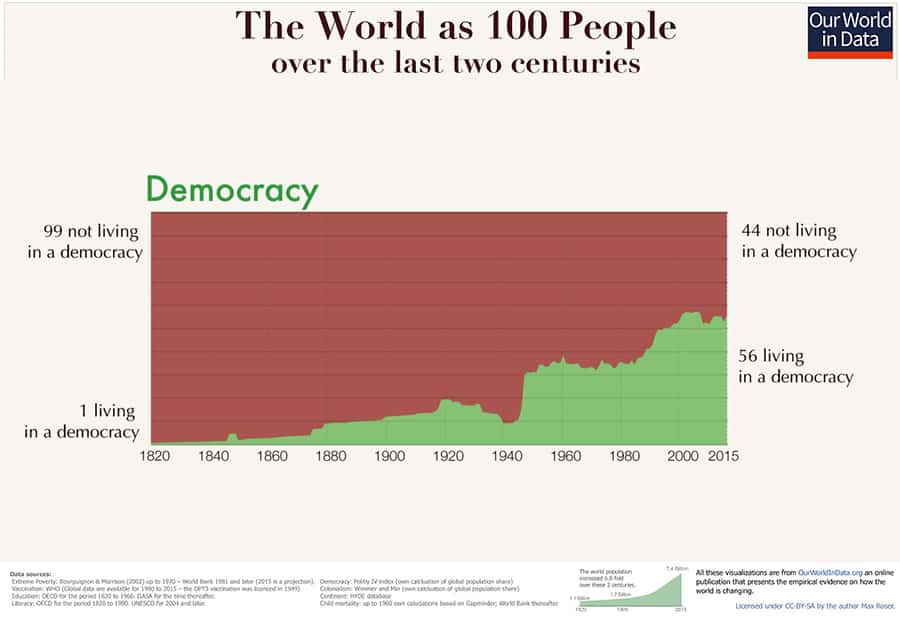
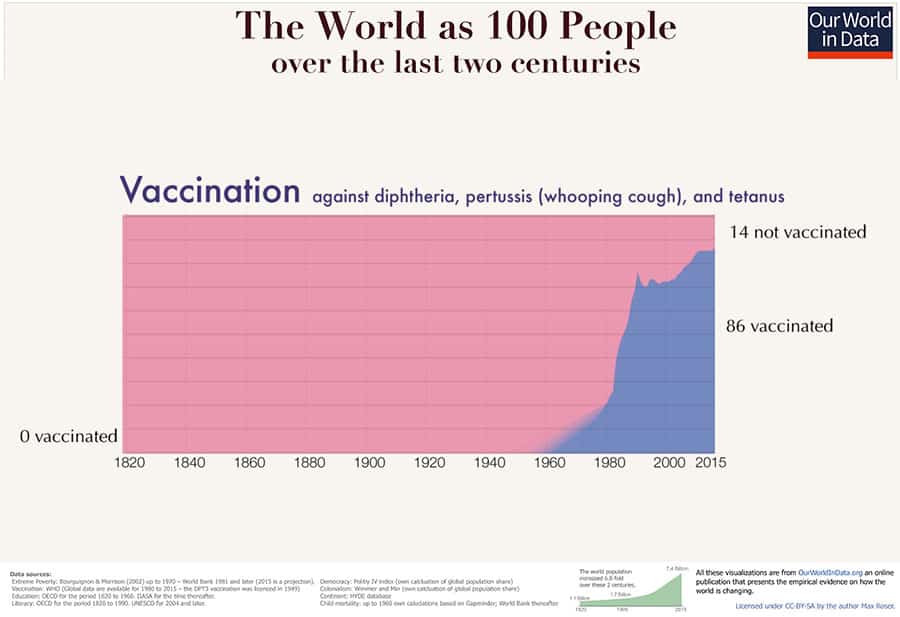
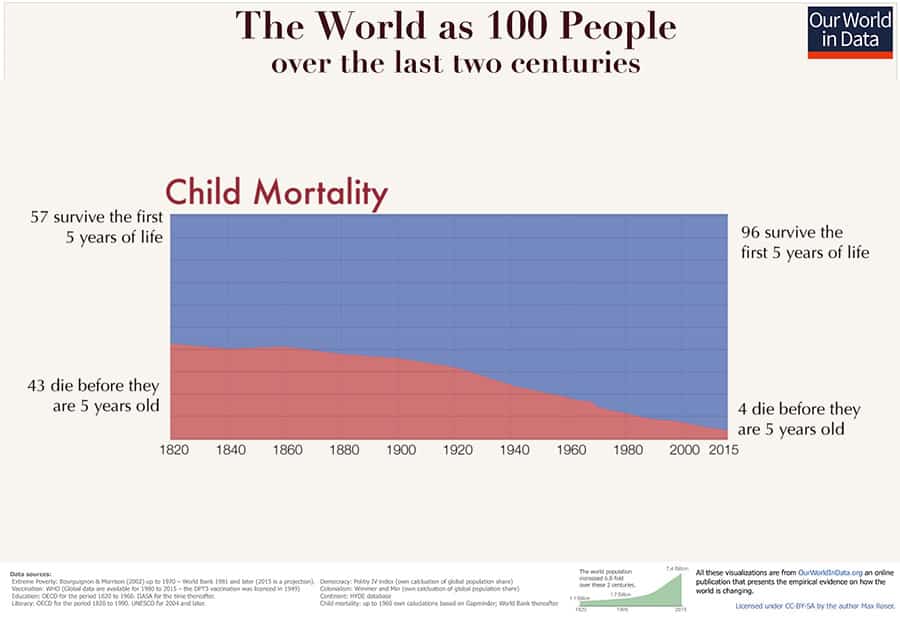
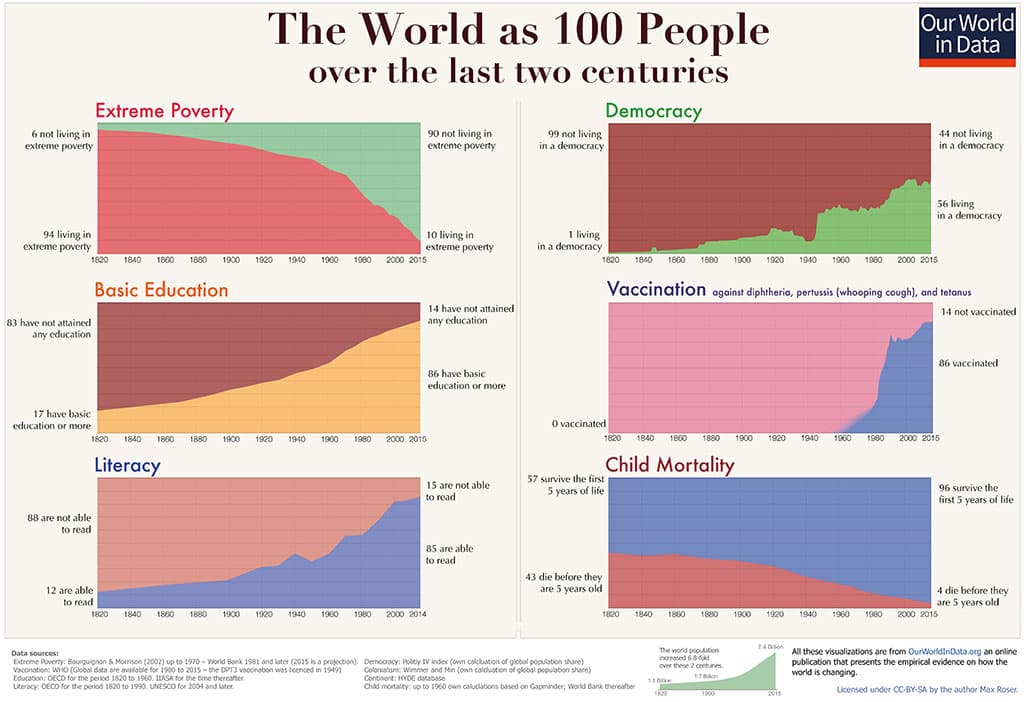
Extraordinarily, these are the six powerful charts showing the positive developments made in the last two centuries throughout the world, according to chart/data released by Max Roser, the Oxford economist behind Our World In Data. It’s important to remember that “absolute poverty” and “child mortality” — are falling in stunning, unprecedented fashion, whereas basic education and literacy have exploded. This has made the world much better off.
It is expected that these rates will continue… and the world as a whole will continue to grow and thrive.
Altogether, these 6 charts prove that the world is getting dramatically better, not worse.
1) Living in Absolute Poverty
The global population living in absolute poverty, which is defined as living on less than 1.90$ per day, has declined. The greatest gains in poverty reduction have come in China and India, which, together, have lifted just short of 1 billion people out of poverty.
2) Basic education: The new study suggests that by 2100, there will be almost no one without formal education.
3) Global literacy rates: Global literacy rates have increased from 10% to nearly 85%, in 1820 only every 10th person was literate; in 1930 it was every third and now we are at 85% globally.
4) The rapid spread of democracy around the globe.
5) Vaccination – Vaccination against some of the worst diseases has become almost universal.
6) Child mortality
These are 6 good charts to show your friend who can’t stop complaining that everything is getting worse, all the time.
By the way, if you have additional evidence showing the positive developments (charts, data, etc.) that you’ve encountered, please email them to me at info@ceoworld.biz
This article is published in collaboration with our Yacht charter partners in Karibik, Griechenland, Frankreich, and Kroatien, chart released by Our World In Data’s Max Roser.
Bring the best of the CEOWORLD magazine's global journalism to audiences in the United States and around the world. - Add CEOWORLD magazine to your Google News feed.
Follow CEOWORLD magazine headlines on: Google News, LinkedIn, Twitter, and Facebook.
Copyright 2025 The CEOWORLD magazine. All rights reserved. This material (and any extract from it) must not be copied, redistributed or placed on any website, without CEOWORLD magazine' prior written consent. For media queries, please contact: info@ceoworld.biz


