

Consumer product companies (FMCG, Durables) are staring at a dip in consumer confidence in India, wherein, the country lost its numero uno position to Indonesia, according to the latest Global Consumer Confidence index published by Nielsen1. Irrespective of this fact, consumer product firms have still managed strong volume growths in FY 2012-13. This growth was buoyed by an increase in advertising and promotion spends on year-on-year basis2.
According to financial reports published recentlya, all the big firms in FMCG saw a rise in double digits in their advertising and sales promotion spends, with Godrej Consumer Products leading the fray at 48%, followed by Emami (34%), HUL (21%) and Marico (11%). The trend is similar for other consumer-oriented sectors as well3.
However, in the third quarter of FY 2012-13, despite Consumer product companies spending a record amount of money on advertising and promoting their products, volume growth eluded most firms5. For instance, HUL, which spent 12.8% of its net sales towards advertising, reported a volume growth of 5%. Similarly, Colgate Palmolive, which spent over 13% of its revenues towards marketing, reported a lower volume growth of 6-7% for the quarter. Dabur, despite increasing its ad spend to 12.8% of its revenues, could not push its volume growth above 10%9 .As a percentage of sales, 12 out of 20 consumer packaged goods companies increased their ad spending but failed to improve sales in the December quarter over the same period last year9. If growth in advertising and promotions is going to be at a pace much faster than growth in volumes, the impact will be negative on profitability. In this scenario, it behooves us to analyze the utilization of advertising and promotion spends in order to find the gaps and improve its effectiveness.
A large part of the marketing and promotions expenses are focused on providing product discounts to channel partners (retailers/wholesalers/resellers) to bolster the volume growth or trade promotion expenses. Our experience shows that typically the figure varies from 20% of the total spend on advertising and promotions for leading FMCG companies to around 60 % for certain consumer durable companies. The discounts are doled out in various methods from lucrative foreign trip schemes, attractive gifts like gold, appliances etc., to bonus pack deals and straightforward cash discounts. Most of these schemes are time-bound to meet a specific volume target9. These tactics are followed since firms believe that –
a) The primary need of the trade channel is to have a higher margin4. As a result, the channel partner will be motivated to sell more as he has a considerable influence on the final purchasing decision of the consumer.
b) The approach is ‘not just a carrot, but also a “stick” – by blocking the capital of the partner in their stock, and hence the retailer/wholesaler will be forced to sell more products.
The assumptions are based on capitalizing on a need to motivate the trade partner. Hence to check the validity of the above assumptions, we need to understand the real need of any trade partner. Any trader is in the business of investing money in buying and then selling them over a period of time. The cash from sales not just gives him margins, but also allows him to buy the next lot of inventory. So the money he makes in a period is not just dependent on margins, but also the number of times he makes a rotation from his investment. This essence is captured by the financial term – return on investment (ROI).
A typical ROI equation of a trade partner will be as below –
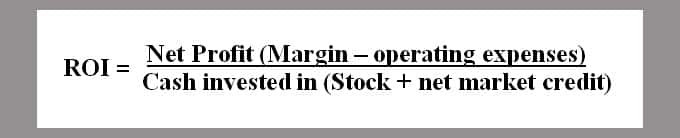
The investment is in stock as well as net market credit (credit offered – credit received from brand supplier). Of all the parameters in the above equation, market credit is a parameter, which is not totally in a channel partner’s control, and where the operational expenses cannot be reduced beyond a certain level. Hence the amount of money he makes is guided by interplay of two important factors – the margin and the cash invested in stock. In essence, to make more money, they have to increase the margins or reduce the cash invested in stock or in other words ‘increase the inventory rotations’.

In reality, the channel partner knows intuitively that the firms would like to block entry of other firms through blocking his working capital in their stocks. Over the years, this push behaviour of firms coupled with the fact that ‘supply lead times of most industries have stayed at the same level’ has ensured that the inventory turns that a typical channel partner enjoys is also at same levels over the last few decades.
Table 1 : Typical Inventory profile of trader buying from brand supplier operating with a forecasting(push) based supply chain planning. Source: Vector Consulting Research Team
|
Industry Sector |
Retailer/Trader/Reseller Inventory in no of days |
| FMCG |
25-30 |
| Consumer Electronics |
40-60 |
| Brown Goods (consumer electricals) |
40-60 |
| Fashion/Textile/Footwear |
180-270 |
| Auto Spare parts |
60-90 |
| Domestic/industrial Motors/Pumps |
60-90 |
| Books |
120-180 |
| Home & office Furniture |
25-40 |
So if a trade partner feels that he cannot impact rotations in a major way, then it is not surprising that he focuses on the margin as a lever to make more money (or maximize ROI).
Before we accept “margin management” as the only practical lever for motivating channel partners, we need to ask a critical question – What is the sensitivity of impact of rotations on ROI of a trade partner in comaprison with the sensitivity of change in margins on ROI?
Below is a simulation of the effect the changes in margins and inventory have on the ROI of the channel partners’ business.
Table 2: simulation of the effect the changes in margins and inventory on the ROI of the channel partners’ business.
| Current | With 10% Increasae in Margin | With 50% reduction in stock | ||
| Total margin |
a |
5 |
5.5 |
5 |
| Operation exp |
b |
2 |
2 |
2 |
| Cash in stock |
x |
10 |
10 |
5 |
| Net Market credit |
y |
10 |
10 |
10 |
| ROI |
(a-b)/(x+y) |
15% |
18% |
20% |
* All figs in lacs Rupees
In the above example, if we are able to reduce the inventory of trade partners by half without compromising on availability, then the ROI jumps much higher than a 10% improvement in the margins. Now the critical question before us is – Which is practically possible: a 10% increase in margins? or a 50% reduction in inventory?
When profitability is under pressure, passing on a 10% increase in margins for the channel partners looks unrealistic. But at the same time, a 50% reduction in inventory looks nearly utopian. But before we reject the idea, let us evaluate both the possibilities. Most companies in India have sufficient number of stocking points closer to the markets that they serve. So to ensure availability the stocks that a trade partner has to hold is only to protect sales during the transportation time from the firms stocking point to their warehouse. In India, the maximum transit time between the stocking point and trader warehouse should not exceed 10 days[1]a. So even if we are slightly conservative, the stocks required to be held by any trade partner in most businesses shouldn’t be more than 15 to 20 days. Current reality as seen before says that for most traders across industries, this figure hovers around 40-60 days, so a drop of 50% in inventory is a practical reality, provided, firms can ensure very high availability at their stocking points on a daily basis.
Instead of a forecasting system, a sure shot way to guarantee availability is to have a rapid response supply chain which operates on pull-based replenishment system across its supply chain (including production and distribution) till the retail point of sale. This requires production systems to be aligned to ensure availability, a topic, which is beyond the scope of this article.
Let us evaluate the option of higher margins from the perspective of a trader. Even when traders have less control on inventory rotations due to supplier practices, they intuitively know the impact of rotations on their business. One way to influence higher rotation is to increase the sale rate of the product from his shelf. Typically, products that move faster off the shelves are established brands in that segment, and new or niche products would be at the other end of the spectrum. For a category like toothpaste, Colgate Dental Cream 200 gm tube would have a faster rate of sale than Colgate Active Salt 200 gm. Typically the margins of faster moving products are lower. Within the same product type, a new ( or relatively unkown) brand is likely to have higher margins than other established brands.
1aBetween the two extreme longitudes, the length of India is 3,214 km from north to south. Considering all delays at state borders and poor road conditions, a typical truck in India covers an average of just 300 kilometers a day, therefore, it can cover the length of India in ten days. In reality, many roads in India are in a better condition, which allows a travel of 800 kilometers in a day, therefore ,the maximum length of India can be covered in four days6
The key question before us is – Can the retailer influence the sale rate of a product from his shelf significantly based on what he would like to sell for maximizing his profits? Is it within his control, and if yes, what criteria does he use to influence the same? These questions need to be answered because the premise of most trade promotion schemes is better margins and its assumed influence on motivation of retailers to sell.
Vector Consulting has conducted an experiment to test the hypothesis if a retailer’s motivation in a brand has a direct positive impact on the way he tries to “push” a brand over others. The best way to test the hypothesis is a mom and a pop store, because, in such a store, there is a chance of interaction between the buyer and seller (the owner in most cases). At the same time, for the test, we can create a condition where the buyer is indifferent to any brand, making it very easy for the retailer to “push” his preference to the customer. As a predicted effect, we should see the retailer more than willing to actually sell the high-margin brand to the “innocent” buyer.
During the experiment, several volunteers across firms were asked to go to any retailer (other than self–service shops) and ask for a brand of toothpaste and openly claim that they are indifferent to any brand – the shopkeeper can decide for them. The volunteers were told to stick to their stance of indifference to a brand in the entire buying process and allow the retailer to decide for them. They had to buy the first brand of toothpaste that was offered to them. The retailer population with stocks of leading and non-leading brands were only considered for the test.
Table 3: Summery of the results of the experiment
| Particulars | Instances | Instances as a % of total |
| No. of Test Runs |
1200 |
– |
| Bought Leading Brand |
1164 |
97% |
| Bought Non-Leading Brand |
36 |
3% |
| Both brands available – Effective test runs |
1091 |
91% |
| Bought leading brand in effective test runs |
1047 |
96% |
| Bought non-leading brand in effective test runs |
44 |
4% |
| Leading brands |
Colgate, Pepsodent, Close up |
|
| Non-leading brands |
Babool, Meswak, Promise , Anchor |
|
The results were opposite to the predicted effect – The retailer preferred selling the established brand with low margins despite having stocks of the non-leading high margin brands . Similar behavoir of a retailer had been studied by Jacoby et all (1984) and it was found that a retailer prefers selling the established brand as it positively influences consumers’ image of the retailer, which in turn, motivates him to sell more of the established brand despite low margins7. Similarly, the behavior of a retailer in relation to selling brands has been studied by Frederick E. Webster, Jr (2000) and he found that a retailer prefers to sell established or popular brands as it has potential benefits both for retailers, in the form of increased patronage and higher absolute margins through more sales, and for consumers in the form of implicit guarantees of quality and particular product attributes8.
If the retailer prefers to sell low-margin established brand in a situation where customers have zero brand preference, do we expect him to spend time in converting a customer preferring a low-margin established brand to a higher-margin brand?
The key insight of the test shows that the level of margins does not impact the way a retailer tries to influence a customer for a brand. In fact, he prefers selling low-margin products (or the established brand) over others, unless the customer wants to buy other brands.
Subsequent discussions with the retailers revealed the reason behind the seemingly counterintuitive behaviour. A retailer is more concerned about having a customer prefer his shop rather than a brand of a specific product of his portfolio, and, given a choice to decide for a customer, he would always want to sell a “safe” brand. This is one of the reasons why retailers end up having significant stock of items, which are slow-moving for a significant period of time. Most of such stocks are usually bought as part of some schemes in distant past. If retailers had such influence on customers, then they would not have such significant slow moving stocks.
Various versions of the test were run using a variety of products – low involvement products like toothpaste to very high involvement products like auto spare parts. The results were strikingly the same.
Hence higher margins actually do not help the channel partner’s cause and thus does not motivate him to sell more. End of the day, it is the customer who decides the sale rate and hence it makes sense to deploy the entire promotional budget on creating real demand so that more customers ask for the product. Ideally, it should be invested in controlling the parameters that influence the purchase behaviour of a consumer. These can vary from directly motivating the key influencer in the buying process or investing in on-shop activities which helps customer understand and appreciate the features of products and its benefits.
Clearly, the distribution schemes are not helpful to motivate the channel partners to create real demand for additional sales. But, at the same time, withdrawing them may also have a negative effect. In most cases, the schemes are used to get rid of excess or undesired stocks to the next link in chain created primarily out of forecasting errors. So if we have to withdraw the channel schemes, we also have to ensure that one has the right inventory at the right place and time. This requires one to move away from push-based production and distribution to a pull-based supply chain.
Fleetguard Filters – a leading manufacturer of heavy duty air, fuel and lube filters – implemented a pull-based replenishment system till its retailers, and thus enabling itself to focus its promotional budget to induce real demand for its product in the auto ancillaries’ replacement market.
Fleetguard realized that the paramount decision clincher in the purchase of a filter is not the retailer, but the recommendation of the local mechanic who finally changes the filters. The firm implemented a lifetime loyalty programme, wherein, an enrolled mechanic enjoys a point-based reward system for every filter that he recommends. The lifetime loyalty prevents the “peaks” (created near scheme closure) and “troughs” (immediately after the scheme closure) in the supply chain, bringing stability to the pull-based supply chain planning systems.

Table 4: A comparison of Fleetguard’s sales and spend through Mechanic Loyalty Programme
| Particulars | FY 2008-09 | FY 2012-13 |
| No. of participants |
4000 |
34000 |
| % of sale through MLP* |
20% |
60% |
| % Spend on MLP against sales income |
5.5% |
5.5% |
*MLP: Mechanic Loyalty Programme
In fact, now all the trade related schemes for the retailer and the distributer have been diverted to only fund the Mechanic Loyalty Programme. The retailer and the distributer enjoy what they really want the most – a very high return on investment in fleetguard business. With a hassle-free participation and reimbursement system, this programme has given Fleetguard a decisive edge over its competition today. Its repalcement market sales growth is consistent and the best in the industry, over a period of last 5 years. Most importantly, it has managed to build a system, where its promotional costs remain stable and likely to come down year-on-year irrespective of what the competition is.
The Fleetguard case study and the results of the test throw up an important question before us –
• If higher margins (delivered in terms of trade promotion schemes) are not the significant need of the channel partners, then why is it perceived to be the significant need?
The answer lies in the way brand suppliers and channel partners view the inventory in the chain. On one side, due to push supply policies of brand owners, most trade partners have given up on the opportunity to significantly impact the inventory turns of the business, and hence negotiate on what can be impacted – the margins. This argument has been supported by a study by Frederick E. Webster, Jr (2000) , which revealed that push strategies leads suppliers to provide higher margins for retailers(trade partners) to support their selling efforts, while pull strategies generate higher margins for the supplier8. At the same time, brand owners have also assumed that lowering the inventory of trade partners is not in their interests. So the only way to motivate channel partners is margins.The end result is a partnership of loss: wasteful schemes of brand owners and an unproductive locking of capital of retailers.
 References:
1. T .M. Kaul and A. Nair, “India Slips to Second in Nielsen’s Global Consumer Confidence Index; Measures at 120 in Q1 2013,” May 1, 2013.
2. Sapna Agarwal, “FMCG firms likely to report a drop in Mar quarter sales growth,” April 10, 2013.
3. India Bulls,“ FMCG expects concrete measures regarding the roll-out of GST in upcoming budget,” Feb 19, 2013.
4. Julian Dent,“ Distribution Channels: Understanding and Managing Channels to Market”, (Kogan Page Publishers, 2011).
5. K.K.Somvanshi,“Despite high spend on advertisements, FMCG companies such as HUL, Dabur, Colgate Palmolive others see low volume growth,”Feb 5, 2013.
6.P. M. Pagadala and S. Mulaik,“ Now’s the time for an India strategy,” Quarter 1, 2009 issue.
7.Jacoby, Jacob, and D. Mazursky (1984), “Linking Brand and Retailer Images – Do the Potential Risks Outweigh the Potential Benefits?” Journal of Retailing, Vol. 60, No. 2, 105-122.
8.Frederick E. Webster, Jr.,“ Understanding the Relationships among Brands, Consumers, and Resellers”, Journal of the Academy of Marketing Science 2000; 28; 17.
AUTHORS: Puneet Kulraj is a leading certified TOC expert and the Founding Director of Vector Consulting Group (www.vectorconsulting.in), a leading consulting firm in India in the space Theory of Constraints consulting.
Murali Krishna is a certified TOC expert in Supply chain and works with Vector Consulting Group. He has ten years of industry and consulting experience, of which seven years have been in channel sales management and the past three years have been in TOC consulting.
RESEARCH METHODOLOGY: This study involves designing an experiment and conducting simulations for assessing causality; which is supported by philosophical approaches that emphasize explanation, case reference and literature review from primary studies. The conclusions have been drawn into a holistic interpretation to bring new transformative management ideas.
Add CEOWORLD magazine to your Google News feed.
Follow CEOWORLD magazine headlines on: Google News, LinkedIn, Twitter, and Facebook.
Copyright 2024 The CEOWORLD magazine. All rights reserved. This material (and any extract from it) must not be copied, redistributed or placed on any website, without CEOWORLD magazine' prior written consent. For media queries, please contact: info@ceoworld.biz