
Covid-19 continues to spread fear and volatility in the financial markets, it feels endless at the moment, though one day, it will end.
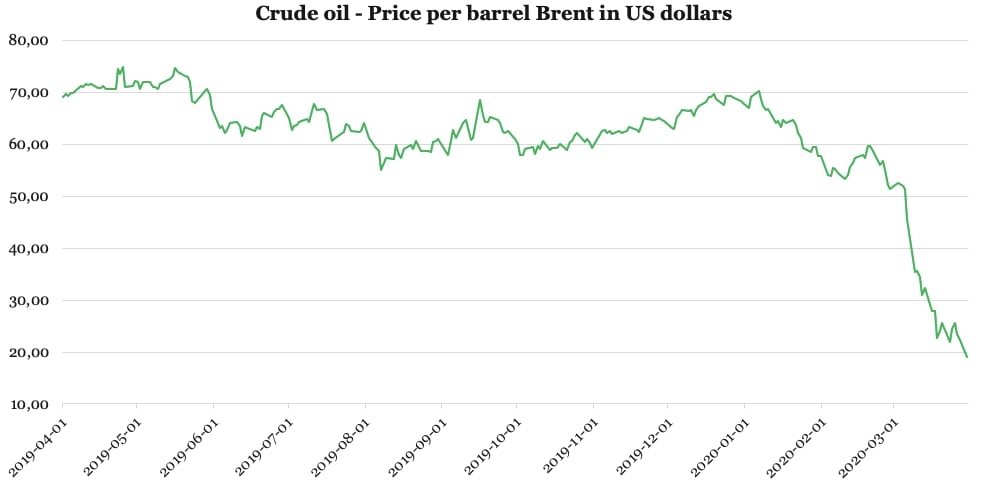
When I first considered how negative the stock markets would react to the Covid-19 over a month ago, I didn’t include a price war in the oil market in my assessment. If somebody for had asked me then whether I believed that large oil producing countries would initiate an aggressive price war in a market with a strongly rising oversupply, then I would never have thought it to be possible. But as seen so often before, reality turned out to be different compared to the expectation, and the result was an unusually big and steep dive in the oil price, as shown in graphic one.
Combined with the negative market reactions from the price war in the oil market, one could in retrospect, argue for a total drop of 20 to 25 pct. in the US stock market, as stocks were trading at a very high level ahead of the Covid-19 outbreak. I argued that the virus could provoke a 15 drop, but since then, Wall Street touched a low of minus 35 pct.
But my view from just 1½ months ago included an argument, or precondition, that I didn’t imagine would turn out to be of very high importance.
I argued that my biggest fear was not the virus as such, but the precautions that the governments would introduce. At that time, I argued that governments should cover all costs in the economies as a result of whatever type of precaution will be taken by governments or public institutions in the Covid-19 fight.
My concern was that precautions taken with only partial economic compensation, or maybe even none, could easily lead to economic havoc, and I argued that it was with good reason why governments should include economic sensibility in their solutions. In that context, it was truly unimaginable to me that even Western governments could lock down whole economies, more so in a very quick manner.
Because governments have responded so vigorously, it’s not surprising that many people around the world consider Covid-19 as the biggest threat since World War II. This has created a situation where almost all 7.8 billion people on the planet are afraid of the virus, so it is no wonder that the global economy is stopping for several reasons.
Many often look for comparisons to prior crises, but each crisis also has its own inertia, or new features so to say, with the social medias (SoMe) playing a completely different role this time, compared to prior crises.
My assessment is that the SoMe effect is now an outright volatility-enhancing element, with the best example being Facebook, which in 2008, had 0.1 billion users and now has 2.5 billion users. That’s 25x more users than the last crisis. With virtually the whole world being nervous to some extent, I argue that this fear is further exacerbated by the SoMe effect.
About the Covid-19 situation, my main scenario is that a vaccine will be developed. A general assumption is that it might take another 12 months before it is ready, but Johnson & Johnson will already test their vaccine in September, and the company trusts they have a vaccine ready for the market in early 2021. Thus, the company joins in the competition against the other heavy pharmaceutical players such as Sanofi, GSK and Pfizer. Biotech company Mordena, began testing their vaccine last month, and even the British American Tobacco Company claims to have a vaccine ready by June.
In parallel, a number of attempts are being made to alleviate the course of a disease on infected patients. The most famous drug is probably chloroquine against malaria, but a tuberculosis drug is also being tested, and Germany has reportedly bought several million packages of Avigan, used in Japan against the flu.
This race for solutions is happening quite quickly, though I do not think that this has been given any positive weight in the financial markets yet. More importantly, the medical developments will, at some point, lower the general fear of the population and the SoMe effect will reverse, with a myriad of positive stories gaining dominance on social media- if a medical solution is developed.
However, this does not change the fact that the many shutdowns of countries are simply equivalent to a daily value destruction which must be corrected for in the stock market. Some Emerging Markets countries will have a hard time, but I am more concerned about how investors will respond to a possible increase in the spread of infection when some countries start to reopen again. In addition, bad news from the US can hit the financial markets in the coming two to three weeks, but fundamentally, one should not underestimate some of the positive elements in the US economy.
Prior to the Covid-19 crisis, private consumption was quite robust. This was due to the strong labour market, though I recognize that many people are losing their jobs right now in the US. Hopefully, many will get help via the government’s aid package, but most jobs are lost in the service sector, though I expect this sector to recover pretty quickly. Moreover, interest rates are low, gasoline prices are low, and households are significantly less indebted than in the past, which is shown in graphic two. The same can be observed in the household debt as percentage of GDP, which at the start of the global financial crisis in 2008 was approximately 100 pct. of the American GDP but is now only 76.3 pct. of GDP.
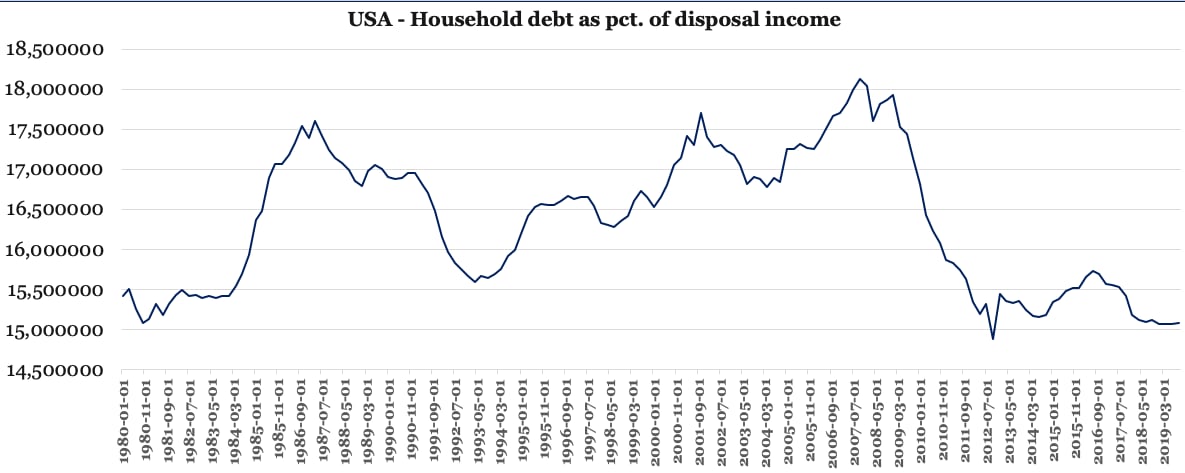
This situation is twofold because the development also includes a growth in low-paid jobs. For these employees, the pay does not provide sufficient household income to generate a credit rating that is strong enough to get a loan. Though the main conclusion from graphic two is that many American household debt/equity ratios are significantly better than in typical times of crises. Thus, there are very good conditions for a private consumption jump in the US once the American economy is back on track again.
These are positive elements that I do not believe are priced in the financial markets. But the time until they start to play a role can drag out, and the nervousness can, for the meantime develop to renewed fear, or maybe even panic in the financial markets. Therefore, if one decides to stay with the current risk in the portfolio, or even increase it, one should also have a clear opinion about at which levels to reduce the risk again, as everything can still happen in the financial markets.
Graphic one: Crude oil Price per barrel Brent in US dollars
Crude oil Price per barrel Brent in US dollars
| Date | Crude oil Price |
|---|---|
| 2019-04-01 00:00:00 | 69.08 |
| 2019-04-02 00:00:00 | 69.68 |
| 2019-04-03 00:00:00 | 69.21 |
| 2019-04-04 00:00:00 | 69.8 |
| 2019-04-05 00:00:00 | 69.93 |
| 2019-04-08 00:00:00 | 71.12 |
| 2019-04-09 00:00:00 | 71.02 |
| 2019-04-10 00:00:00 | 71.63 |
| 2019-04-11 00:00:00 | 71.3 |
| 2019-04-12 00:00:00 | 71.57 |
| 2019-04-15 00:00:00 | 70.9 |
| 2019-04-16 00:00:00 | 70.74 |
| 2019-04-17 00:00:00 | 71.14 |
| 2019-04-18 00:00:00 | 70.71 |
| 2019-04-22 00:00:00 | 70.71 |
| 2019-04-23 00:00:00 | 74.39 |
| 2019-04-24 00:00:00 | 73.59 |
| 2019-04-25 00:00:00 | 74.94 |
| 2019-04-26 00:00:00 | 71.03 |
| 2019-04-29 00:00:00 | 71.22 |
| 2019-04-30 00:00:00 | 72.19 |
| 2019-05-01 00:00:00 | 72.01 |
| 2019-05-02 00:00:00 | 70.56 |
| 2019-05-03 00:00:00 | 71.95 |
| 2019-05-06 00:00:00 | 71.95 |
| 2019-05-07 00:00:00 | 70.98 |
| 2019-05-08 00:00:00 | 71.09 |
| 2019-05-09 00:00:00 | 70.61 |
| 2019-05-10 00:00:00 | 71.63 |
| 2019-05-13 00:00:00 | 72.35 |
| 2019-05-14 00:00:00 | 72.53 |
| 2019-05-15 00:00:00 | 73.09 |
| 2019-05-16 00:00:00 | 74.7 |
| 2019-05-17 00:00:00 | 73.94 |
| 2019-05-20 00:00:00 | 73.21 |
| 2019-05-21 00:00:00 | 72.94 |
| 2019-05-22 00:00:00 | 71.94 |
| 2019-05-23 00:00:00 | 68.37 |
| 2019-05-24 00:00:00 | 67.98 |
| 2019-05-28 00:00:00 | 70.19 |
| 2019-05-29 00:00:00 | 70.64 |
| 2019-05-30 00:00:00 | 69.55 |
| 2019-05-31 00:00:00 | 66.78 |
| 2019-06-03 00:00:00 | 63.16 |
| 2019-06-04 00:00:00 | 63.56 |
| 2019-06-05 00:00:00 | 62.14 |
| 2019-06-06 00:00:00 | 62.77 |
| 2019-06-07 00:00:00 | 64.1 |
| 2019-06-10 00:00:00 | 64.31 |
| 2019-06-11 00:00:00 | 63.56 |
| 2019-06-12 00:00:00 | 61.66 |
| 2019-06-13 00:00:00 | 63.28 |
| 2019-06-14 00:00:00 | 63.13 |
| 2019-06-17 00:00:00 | 62.56 |
| 2019-06-18 00:00:00 | 63.35 |
| 2019-06-19 00:00:00 | 62.85 |
| 2019-06-20 00:00:00 | 65.44 |
| 2019-06-21 00:00:00 | 65.99 |
| 2019-06-24 00:00:00 | 65.16 |
| 2019-06-25 00:00:00 | 66.24 |
| 2019-06-26 00:00:00 | 66.85 |
| 2019-06-27 00:00:00 | 66.78 |
| 2019-06-28 00:00:00 | 67.52 |
| 2019-07-01 00:00:00 | 65.1 |
| 2019-07-02 00:00:00 | 62.72 |
| 2019-07-03 00:00:00 | 63.53 |
| 2019-07-04 00:00:00 | 63.62 |
| 2019-07-05 00:00:00 | 64.23 |
| 2019-07-08 00:00:00 | 64.89 |
| 2019-07-09 00:00:00 | 64.3 |
| 2019-07-10 00:00:00 | 66.41 |
| 2019-07-11 00:00:00 | 67.64 |
| 2019-07-12 00:00:00 | 66.65 |
| 2019-07-15 00:00:00 | 66.86 |
| 2019-07-16 00:00:00 | 65.87 |
| 2019-07-17 00:00:00 | 63.67 |
| 2019-07-18 00:00:00 | 60.7 |
| 2019-07-19 00:00:00 | 61.04 |
| 2019-07-22 00:00:00 | 61.96 |
| 2019-07-23 00:00:00 | 62.28 |
| 2019-07-24 00:00:00 | 63.83 |
| 2019-07-25 00:00:00 | 63.47 |
| 2019-07-26 00:00:00 | 62.46 |
| 2019-07-29 00:00:00 | 62.29 |
| 2019-07-30 00:00:00 | 62.55 |
| 2019-07-31 00:00:00 | 64.07 |
| 2019-08-01 00:00:00 | 62.9 |
| 2019-08-02 00:00:00 | 61.12 |
| 2019-08-05 00:00:00 | 59.32 |
| 2019-08-06 00:00:00 | 58.63 |
| 2019-08-07 00:00:00 | 55.03 |
| 2019-08-08 00:00:00 | 56.29 |
| 2019-08-09 00:00:00 | 57.37 |
| 2019-08-12 00:00:00 | 57.13 |
| 2019-08-13 00:00:00 | 59.9 |
| 2019-08-14 00:00:00 | 57.86 |
| 2019-08-15 00:00:00 | 57.37 |
| 2019-08-16 00:00:00 | 59 |
| 2019-08-19 00:00:00 | 59.79 |
| 2019-08-20 00:00:00 | 59.03 |
| 2019-08-21 00:00:00 | 60.6 |
| 2019-08-22 00:00:00 | 59.81 |
| 2019-08-23 00:00:00 | 58.64 |
| 2019-08-26 00:00:00 | 58.64 |
| 2019-08-27 00:00:00 | 58.44 |
| 2019-08-28 00:00:00 | 60.42 |
| 2019-08-29 00:00:00 | 60.59 |
| 2019-08-30 00:00:00 | 61.04 |
| 2019-09-02 00:00:00 | 58.55 |
| 2019-09-03 00:00:00 | 57.93 |
| 2019-09-04 00:00:00 | 60.68 |
| 2019-09-05 00:00:00 | 62.7 |
| 2019-09-06 00:00:00 | 61.28 |
| 2019-09-09 00:00:00 | 63.99 |
| 2019-09-10 00:00:00 | 64.67 |
| 2019-09-11 00:00:00 | 63.02 |
| 2019-09-12 00:00:00 | 60.76 |
| 2019-09-13 00:00:00 | 61.25 |
| 2019-09-16 00:00:00 | 68.42 |
| 2019-09-17 00:00:00 | 65.59 |
| 2019-09-18 00:00:00 | 64.29 |
| 2019-09-19 00:00:00 | 64.25 |
| 2019-09-20 00:00:00 | 65.23 |
| 2019-09-23 00:00:00 | 64.66 |
| 2019-09-24 00:00:00 | 64.13 |
| 2019-09-25 00:00:00 | 62.41 |
| 2019-09-26 00:00:00 | 62.08 |
| 2019-09-27 00:00:00 | 62.48 |
| 2019-09-30 00:00:00 | 60.99 |
| 2019-10-01 00:00:00 | 60.06 |
| 2019-10-02 00:00:00 | 57.92 |
| 2019-10-03 00:00:00 | 58.01 |
| 2019-10-04 00:00:00 | 59.13 |
| 2019-10-07 00:00:00 | 59.46 |
| 2019-10-08 00:00:00 | 58.14 |
| 2019-10-09 00:00:00 | 59.7 |
| 2019-10-10 00:00:00 | 59.08 |
| 2019-10-11 00:00:00 | 60.59 |
| 2019-10-14 00:00:00 | 58.81 |
| 2019-10-15 00:00:00 | 59.19 |
| 2019-10-16 00:00:00 | 59.3 |
| 2019-10-17 00:00:00 | 59.35 |
| 2019-10-18 00:00:00 | 59.96 |
| 2019-10-21 00:00:00 | 58.95 |
| 2019-10-22 00:00:00 | 60.5 |
| 2019-10-23 00:00:00 | 60.52 |
| 2019-10-24 00:00:00 | 61.71 |
| 2019-10-25 00:00:00 | 62.06 |
| 2019-10-28 00:00:00 | 60.39 |
| 2019-10-29 00:00:00 | 61.05 |
| 2019-10-30 00:00:00 | 60.22 |
| 2019-10-31 00:00:00 | 59.3 |
| 2019-11-01 00:00:00 | 60.17 |
| 2019-11-04 00:00:00 | 62.52 |
| 2019-11-05 00:00:00 | 62.72 |
| 2019-11-06 00:00:00 | 62.11 |
| 2019-11-07 00:00:00 | 62.6 |
| 2019-11-08 00:00:00 | 62 |
| 2019-11-11 00:00:00 | 62.58 |
| 2019-11-12 00:00:00 | 62.19 |
| 2019-11-13 00:00:00 | 62.27 |
| 2019-11-14 00:00:00 | 62.46 |
| 2019-11-15 00:00:00 | 63.32 |
| 2019-11-18 00:00:00 | 62.82 |
| 2019-11-19 00:00:00 | 62.37 |
| 2019-11-20 00:00:00 | 63.8 |
| 2019-11-21 00:00:00 | 64.99 |
| 2019-11-22 00:00:00 | 64.83 |
| 2019-11-25 00:00:00 | 64.67 |
| 2019-11-26 00:00:00 | 64.82 |
| 2019-11-27 00:00:00 | 65.03 |
| 2019-11-28 00:00:00 | 64.68 |
| 2019-11-29 00:00:00 | 64.5 |
| 2019-12-02 00:00:00 | 63.2 |
| 2019-12-03 00:00:00 | 62.95 |
| 2019-12-04 00:00:00 | 65.25 |
| 2019-12-05 00:00:00 | 65.67 |
| 2019-12-06 00:00:00 | 66.5 |
| 2019-12-09 00:00:00 | 66.44 |
| 2019-12-10 00:00:00 | 66.57 |
| 2019-12-11 00:00:00 | 65.37 |
| 2019-12-12 00:00:00 | 66.67 |
| 2019-12-13 00:00:00 | 67.44 |
| 2019-12-16 00:00:00 | 68.04 |
| 2019-12-17 00:00:00 | 68.99 |
| 2019-12-18 00:00:00 | 69.12 |
| 2019-12-19 00:00:00 | 69.7 |
| 2019-12-20 00:00:00 | 68.66 |
| 2019-12-23 00:00:00 | 67.49 |
| 2019-12-24 00:00:00 | 69.26 |
| 2019-12-26 00:00:00 | 69.26 |
| 2019-12-27 00:00:00 | 68.91 |
| 2019-12-30 00:00:00 | 68.3 |
| 2019-12-31 00:00:00 | 67.77 |
| 2020-01-02 00:00:00 | 67.05 |
| 2020-01-03 00:00:00 | 69.08 |
| 2020-01-06 00:00:00 | 70.25 |
| 2020-01-07 00:00:00 | 68.74 |
| 2020-01-08 00:00:00 | 67.31 |
| 2020-01-09 00:00:00 | 66.58 |
| 2020-01-10 00:00:00 | 66.77 |
| 2020-01-13 00:00:00 | 64.14 |
| 2020-01-14 00:00:00 | 64.45 |
| 2020-01-15 00:00:00 | 63.29 |
| 2020-01-16 00:00:00 | 64.63 |
| 2020-01-17 00:00:00 | 64.05 |
| 2020-01-20 00:00:00 | 64.63 |
| 2020-01-21 00:00:00 | 63.66 |
| 2020-01-22 00:00:00 | 62.11 |
| 2020-01-23 00:00:00 | 61.26 |
| 2020-01-24 00:00:00 | 59.34 |
| 2020-01-27 00:00:00 | 58.54 |
| 2020-01-28 00:00:00 | 59.37 |
| 2020-01-29 00:00:00 | 59.46 |
| 2020-01-30 00:00:00 | 57.72 |
| 2020-01-31 00:00:00 | 57.77 |
| 2020-02-03 00:00:00 | 54 |
| 2020-02-04 00:00:00 | 53.9 |
| 2020-02-05 00:00:00 | 55.36 |
| 2020-02-06 00:00:00 | 55.18 |
| 2020-02-07 00:00:00 | 54.53 |
| 2020-02-10 00:00:00 | 53.39 |
| 2020-02-11 00:00:00 | 54 |
| 2020-02-12 00:00:00 | 55.54 |
| 2020-02-13 00:00:00 | 56.34 |
| 2020-02-14 00:00:00 | 57.37 |
| 2020-02-17 00:00:00 | 57.83 |
| 2020-02-18 00:00:00 | 57.35 |
| 2020-02-19 00:00:00 | 59.72 |
| 2020-02-20 00:00:00 | 59.72 |
| 2020-02-21 00:00:00 | 58.6 |
| 2020-02-24 00:00:00 | 56.04 |
| 2020-02-25 00:00:00 | 56.71 |
| 2020-02-26 00:00:00 | 54.96 |
| 2020-02-27 00:00:00 | 52.19 |
| 2020-02-28 00:00:00 | 51.31 |
| 2020-03-02 00:00:00 | 52.52 |
| 2020-03-03 00:00:00 | 52.24 |
| 2020-03-04 00:00:00 | 51.86 |
| 2020-03-05 00:00:00 | 51.29 |
| 2020-03-06 00:00:00 | 45.6 |
| 2020-03-09 00:00:00 | 35.33 |
| 2020-03-10 00:00:00 | 35.57 |
| 2020-03-11 00:00:00 | 34.45 |
| 2020-03-12 00:00:00 | 31.02 |
| 2020-03-13 00:00:00 | 32.25 |
| 2020-03-16 00:00:00 | 27.98 |
| 2020-03-17 00:00:00 | 27.97 |
| 2020-03-18 00:00:00 | 22.79 |
| 2020-03-19 00:00:00 | 23.98 |
| 2020-03-20 00:00:00 | 25.55 |
| 2020-03-23 00:00:00 | 21.85 |
| 2020-03-24 00:00:00 | 24.5 |
| 2020-03-25 00:00:00 | 25.62 |
| 2020-03-26 00:00:00 | 23.55 |
| 2020-03-27 00:00:00 | 22.39 |
| 2020-03-30 00:00:00 | 19.07 |
Graphic two: USA Household debt as pct. of disposal income
USA Household Debt In US dollars
| Date | USA Household debt |
|---|---|
| 1980-01-01 00:00:00 | 15.419559 |
| 1980-04-01 00:00:00 | 15.50613 |
| 1980-07-01 00:00:00 | 15.26232 |
| 1980-10-01 00:00:00 | 15.088144 |
| 1981-01-01 00:00:00 | 15.138376 |
| 1981-04-01 00:00:00 | 15.32487 |
| 1981-07-01 00:00:00 | 15.18066 |
| 1981-10-01 00:00:00 | 15.322148 |
| 1982-01-01 00:00:00 | 15.425925 |
| 1982-04-01 00:00:00 | 15.495569 |
| 1982-07-01 00:00:00 | 15.418619 |
| 1982-10-01 00:00:00 | 15.426242 |
| 1983-01-01 00:00:00 | 15.39366 |
| 1983-04-01 00:00:00 | 15.416808 |
| 1983-07-01 00:00:00 | 15.394973 |
| 1983-10-01 00:00:00 | 15.420396 |
| 1984-01-01 00:00:00 | 15.425305 |
| 1984-04-01 00:00:00 | 15.540898 |
| 1984-07-01 00:00:00 | 15.691755 |
| 1984-10-01 00:00:00 | 15.929233 |
| 1985-01-01 00:00:00 | 16.369068 |
| 1985-04-01 00:00:00 | 16.474531 |
| 1985-07-01 00:00:00 | 16.885492 |
| 1985-10-01 00:00:00 | 17.066061 |
| 1986-01-01 00:00:00 | 17.064555 |
| 1986-04-01 00:00:00 | 17.183377 |
| 1986-07-01 00:00:00 | 17.330634 |
| 1986-10-01 00:00:00 | 17.539071 |
| 1987-01-01 00:00:00 | 17.394269 |
| 1987-04-01 00:00:00 | 17.600464 |
| 1987-07-01 00:00:00 | 17.419134 |
| 1987-10-01 00:00:00 | 17.242252 |
| 1988-01-01 00:00:00 | 17.145897 |
| 1988-04-01 00:00:00 | 17.082064 |
| 1988-07-01 00:00:00 | 16.997349 |
| 1988-10-01 00:00:00 | 16.849392 |
| 1989-01-01 00:00:00 | 16.792459 |
| 1989-04-01 00:00:00 | 16.976871 |
| 1989-07-01 00:00:00 | 17.053178 |
| 1989-10-01 00:00:00 | 17.007589 |
| 1990-01-01 00:00:00 | 16.900919 |
| 1990-04-01 00:00:00 | 16.875752 |
| 1990-07-01 00:00:00 | 16.888249 |
| 1990-10-01 00:00:00 | 16.960268 |
| 1991-01-01 00:00:00 | 16.960137 |
| 1991-04-01 00:00:00 | 16.818953 |
| 1991-07-01 00:00:00 | 16.703078 |
| 1991-10-01 00:00:00 | 16.479746 |
| 1992-01-01 00:00:00 | 16.160733 |
| 1992-04-01 00:00:00 | 15.971127 |
| 1992-07-01 00:00:00 | 15.826784 |
| 1992-10-01 00:00:00 | 15.752581 |
| 1993-01-01 00:00:00 | 15.673178 |
| 1993-04-01 00:00:00 | 15.593555 |
| 1993-07-01 00:00:00 | 15.669738 |
| 1993-10-01 00:00:00 | 15.641764 |
| 1994-01-01 00:00:00 | 15.690103 |
| 1994-04-01 00:00:00 | 15.761009 |
| 1994-07-01 00:00:00 | 15.914829 |
| 1994-10-01 00:00:00 | 15.99562 |
| 1995-01-01 00:00:00 | 16.198637 |
| 1995-04-01 00:00:00 | 16.411955 |
| 1995-07-01 00:00:00 | 16.52922 |
| 1995-10-01 00:00:00 | 16.572483 |
| 1996-01-01 00:00:00 | 16.558361 |
| 1996-04-01 00:00:00 | 16.557834 |
| 1996-07-01 00:00:00 | 16.606741 |
| 1996-10-01 00:00:00 | 16.664822 |
| 1997-01-01 00:00:00 | 16.631998 |
| 1997-04-01 00:00:00 | 16.653272 |
| 1997-07-01 00:00:00 | 16.64924 |
| 1997-10-01 00:00:00 | 16.548342 |
| 1998-01-01 00:00:00 | 16.32527 |
| 1998-04-01 00:00:00 | 16.305444 |
| 1998-07-01 00:00:00 | 16.275289 |
| 1998-10-01 00:00:00 | 16.349509 |
| 1999-01-01 00:00:00 | 16.422021 |
| 1999-04-01 00:00:00 | 16.602381 |
| 1999-07-01 00:00:00 | 16.727171 |
| 1999-10-01 00:00:00 | 16.658897 |
| 2000-01-01 00:00:00 | 16.532775 |
| 2000-04-01 00:00:00 | 16.659046 |
| 2000-07-01 00:00:00 | 16.806757 |
| 2000-10-01 00:00:00 | 17.057136 |
| 2001-01-01 00:00:00 | 17.146412 |
| 2001-04-01 00:00:00 | 17.419544 |
| 2001-07-01 00:00:00 | 17.298341 |
| 2001-10-01 00:00:00 | 17.701544 |
| 2002-01-01 00:00:00 | 17.40731 |
| 2002-04-01 00:00:00 | 17.275861 |
| 2002-07-01 00:00:00 | 17.304962 |
| 2002-10-01 00:00:00 | 17.225365 |
| 2003-01-01 00:00:00 | 17.1778 |
| 2003-04-01 00:00:00 | 17.056227 |
| 2003-07-01 00:00:00 | 16.82049 |
| 2003-10-01 00:00:00 | 16.900328 |
| 2004-01-01 00:00:00 | 16.881236 |
| 2004-04-01 00:00:00 | 16.777059 |
| 2004-07-01 00:00:00 | 16.896348 |
| 2004-10-01 00:00:00 | 16.845924 |
| 2005-01-01 00:00:00 | 17.257222 |
| 2005-04-01 00:00:00 | 17.252951 |
| 2005-07-01 00:00:00 | 17.315921 |
| 2005-10-01 00:00:00 | 17.263161 |
| 2006-01-01 00:00:00 | 17.248015 |
| 2006-04-01 00:00:00 | 17.364252 |
| 2006-07-01 00:00:00 | 17.524214 |
| 2006-10-01 00:00:00 | 17.664837 |
| 2007-01-01 00:00:00 | 17.700452 |
| 2007-04-01 00:00:00 | 17.823646 |
| 2007-07-01 00:00:00 | 17.988108 |
| 2007-10-01 00:00:00 | 18.132258 |
| 2008-01-01 00:00:00 | 18.041124 |
| 2008-04-01 00:00:00 | 17.608562 |
| 2008-07-01 00:00:00 | 17.810836 |
| 2008-10-01 00:00:00 | 17.869616 |
| 2009-01-01 00:00:00 | 17.925562 |
| 2009-04-01 00:00:00 | 17.523782 |
| 2009-07-01 00:00:00 | 17.446098 |
| 2009-10-01 00:00:00 | 17.145233 |
| 2010-01-01 00:00:00 | 16.820575 |
| 2010-04-01 00:00:00 | 16.425608 |
| 2010-07-01 00:00:00 | 16.225237 |
| 2010-10-01 00:00:00 | 16.079243 |
| 2011-01-01 00:00:00 | 15.872126 |
| 2011-04-01 00:00:00 | 15.826647 |
| 2011-07-01 00:00:00 | 15.738363 |
| 2011-10-01 00:00:00 | 15.635514 |
| 2012-01-01 00:00:00 | 15.34203 |
| 2012-04-01 00:00:00 | 15.19858 |
| 2012-07-01 00:00:00 | 15.314373 |
| 2012-10-01 00:00:00 | 14.886383 |
| 2013-01-01 00:00:00 | 15.44666 |
| 2013-04-01 00:00:00 | 15.358474 |
| 2013-07-01 00:00:00 | 15.326892 |
| 2013-10-01 00:00:00 | 15.360269 |
| 2014-01-01 00:00:00 | 15.24077 |
| 2014-04-01 00:00:00 | 15.169139 |
| 2014-07-01 00:00:00 | 15.154631 |
| 2014-10-01 00:00:00 | 15.186816 |
| 2015-01-01 00:00:00 | 15.340219 |
| 2015-04-01 00:00:00 | 15.384047 |
| 2015-07-01 00:00:00 | 15.476221 |
| 2015-10-01 00:00:00 | 15.520657 |
| 2016-01-01 00:00:00 | 15.52321 |
| 2016-04-01 00:00:00 | 15.656994 |
| 2016-07-01 00:00:00 | 15.726129 |
| 2016-10-01 00:00:00 | 15.694672 |
| 2017-01-01 00:00:00 | 15.571108 |
| 2017-04-01 00:00:00 | 15.560202 |
| 2017-07-01 00:00:00 | 15.52581 |
| 2017-10-01 00:00:00 | 15.414625 |
| 2018-01-01 00:00:00 | 15.180891 |
| 2018-04-01 00:00:00 | 15.125889 |
| 2018-07-01 00:00:00 | 15.090032 |
| 2018-10-01 00:00:00 | 15.12263 |
| 2019-01-01 00:00:00 | 15.070962 |
| 2019-04-01 00:00:00 | 15.067404 |
| 2019-07-01 00:00:00 | 15.065004 |
| 2019-10-01 00:00:00 | 15.084147 |
Written by Peter Lundgreen. Have you read?
# Best (and worst) countries in the world for old people to live in, 2020
# Countries with the highest life expectancy in the world, 2020
# Most expensive countries in the world to live in, 2020
# Most Popular Places To Birdwatch In Each US State
# Best Countries For Investment In Ecommerce And Digital Sector, 2020
Add CEOWORLD magazine to your Google News feed.
Follow CEOWORLD magazine headlines on: Google News, LinkedIn, Twitter, and Facebook.
This report/news/ranking/statistics has been prepared only for general guidance on matters of interest and does not constitute professional advice. You should not act upon the information contained in this publication without obtaining specific professional advice. No representation or warranty (express or implied) is given as to the accuracy or completeness of the information contained in this publication, and, to the extent permitted by law, CEOWORLD magazine does not accept or assume any liability, responsibility or duty of care for any consequences of you or anyone else acting, or refraining to act, in reliance on the information contained in this publication or for any decision based on it.
Copyright 2024 The CEOWORLD magazine. All rights reserved. This material (and any extract from it) must not be copied, redistributed or placed on any website, without CEOWORLD magazine' prior written consent. For media queries, please contact: info@ceoworld.biz
SUBSCRIBE NEWSLETTER