The World’s Top 25 CO2 Emissions Generating Countries: Who Produces the Most Carbon Dioxide?
Topping this list as it tops so many others is China. No country on earth produces more CO2 than China, and it isn’t even close. The next closest culprit — the United States — produces half as much CO2 as China.
China creates almost double the emissions of second-placed the United States, which is in turn responsible for more than twice the level of third-placed India. Just two countries, China and the United States, are responsible for more than 40 percent of the world’s carbon dioxide emissions.
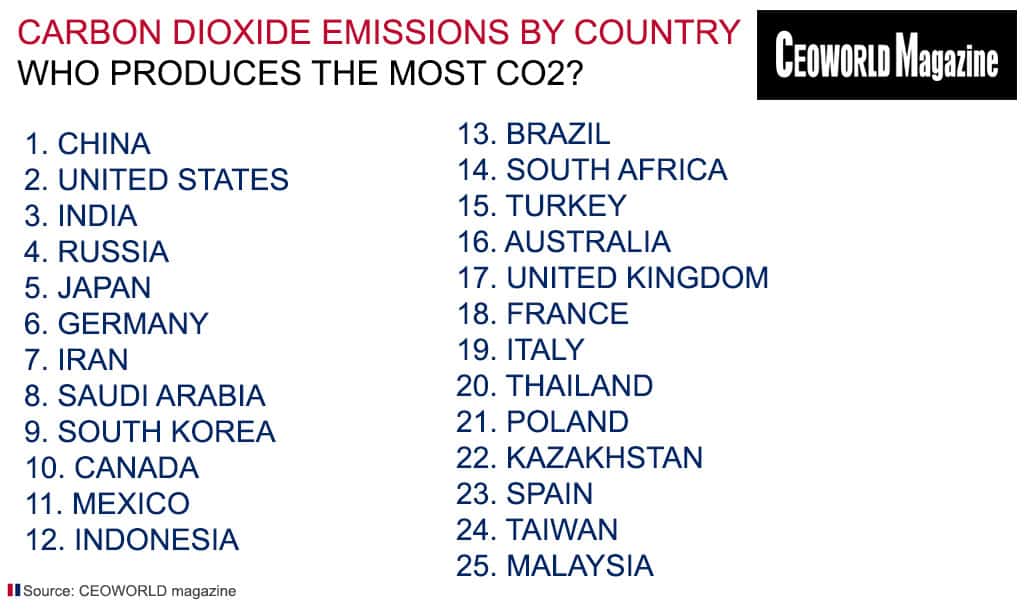
Collectively, the world’s top 15 CO2 emissions-generating countries are responsible for 72% of global carbon dioxide emissions. To determine the top 25 countries emitting the most carbon dioxide, CEOWORLD magazine ranked nations based on territorial emissions – millions of metric tons of carbon emitted from fossil fuels, change from CO2 emissions, and methane emissions within a nation’s borders – published by the Global Carbon Project 2018. Here we list the 25 countries that emitted the most carbon dioxide.
Carbon Dioxide Emissions by Country: Who Produces the Most CO2?
- China
CO2 emissions from fossil fuel (2017): 9,838.8 million metric tons
CO2 emissions from fossil fuel per person (2017): 7.1 metric tons
Change from CO2 emissions in 1992: 270.3%
Methane emissions (2012): 1,752.3 million metric tons (CO2e)
Population (2017): 1.39 billion
GDP per capita (2017): $15,309 - United States
CO2 emissions from fossil fuel (2017): 5,269.5 million metric tons
CO2 emissions from fossil fuel per person (2017): 16.2 metric tons
Change from CO2 emissions in 1992: 1.8%
Methane emissions (2012): 499.8 million metric tons (CO2e)
Population (2017): 325.1 million
GDP per capita (2017): $54,471 - India
CO2 emissions from fossil fuel (2017): 2,466.8 million metric tons
CO2 emissions from fossil fuel per person (2017): 1.8 metric tons
Change from CO2 emissions in 1992: 253.0%
Methane emissions (2012): 636.4 million metric tons (CO2e)
Population (2017): 1.34 billion
GDP per capita (2017): $6,514 - Russia
CO2 emissions from fossil fuel (2017): 1,692.8 million metric tons
CO2 emissions from fossil fuel per person (2017): 11.7 metric tons
Change from CO2 emissions in 1992: -15.1%
Methane emissions (2012): 545.8 million metric tons (CO2e)
Population (2017): 144.5 million
GDP per capita (2017): $24,790 - Japan
CO2 emissions from fossil fuel (2017): 1,205.1 million metric tons
CO2 emissions from fossil fuel per person (2017): 9.5 metric tons
Change from CO2 emissions in 1992: 2.4%
Methane emissions (2012): 39.0 million metric tons (CO2e)
Population (2017): 126.8 million
GDP per capita (2017): $39,011 - Germany
CO2 emissions from fossil fuel (2017): 799.4 million metric tons
CO2 emissions from fossil fuel per person (2017): 9.7 metric tons
Change from CO2 emissions in 1992: -17.3%
Methane emissions (2012): 55.7 million metric tons (CO2e)
Population (2017): 82.7 million
GDP per capita (2017): $45,446 - Iran
CO2 emissions from fossil fuel (2017): 672.3 million metric tons
CO2 emissions from fossil fuel per person (2017): 8.3 metric tons
Change from CO2 emissions in 1992: 196.2%
Methane emissions (2012): 121.3 million metric tons (CO2e)
Population (2017): 81.2 million
GDP per capita (2017): $18,983 - Saudi Arabia
CO2 emissions from fossil fuel (2017): 635.0 million metric tons
CO2 emissions from fossil fuel per person (2017): 19.3 metric tons
Change from CO2 emissions in 1992: 122.8%
Methane emissions (2012): 62.9 million metric tons (CO2e)
Population (2017): 32.9 million
GDP per capita (2017): $48,986 - South Korea
CO2 emissions from fossil fuel (2017): 616.1 million metric tons
CO2 emissions from fossil fuel per person (2017): 12.0 metric tons
Change from CO2 emissions in 1992: 118.3%
Methane emissions (2012): 32.6 million metric tons (CO2e)
Population (2017): 51.5 million
GDP per capita (2017): $35,938 - Canada
CO2 emissions from fossil fuel (2017): 572.8 million metric tons
CO2 emissions from fossil fuel per person (2017): 15.6 metric tons
Change from CO2 emissions in 1992: 22.2%
Methane emissions (2012): 106.8 million metric tons (CO2e)
Population (2017): 36.7 million
GDP per capita (2017): $44,018 - Mexico
CO2 emissions from fossil fuel (2017): 490.3 million metric tons
CO2 emissions from fossil fuel per person (2017): 3.8 metric tons
Change from CO2 emissions in 1992: 46.7%
Methane emissions (2012): 116.7 million metric tons (CO2e)
Population (2017): 129.2 million
DP per capita (2017): $17,331 - Indonesia
CO2 emissions from fossil fuel (2017): 486.8 million metric tons
CO2 emissions from fossil fuel per person (2017): 1.8 metric tons
Change from CO2 emissions in 1992: 139.0%
Methane emissions (2012): 223.3 million metric tons (CO2e)
Population (2017): 264.0 million
GDP per capita (2017): $11,189 - Brazil
CO2 emissions from fossil fuel (2017): 476.1 million metric tons
CO2 emissions from fossil fuel per person (2017): 2.3 metric tons
Change from CO2 emissions in 1992: 118.0%
Methane emissions (2012): 477.1 million metric tons (CO2e)
Population (2017): 209.3 million
GDP per capita (2017): $14,137 - South Africa
CO2 emissions from fossil fuel (2017): 456.3 million metric tons
CO2 emissions from fossil fuel per person (2017): 8.0 metric tons
Change from CO2 emissions in 1992: 51.6%
Methane emissions (2012): 63.2 million metric tons (CO2e)
Population (2017): 56.7 million
GDP per capita (2017): $12,294 - Turkey
CO2 emissions from fossil fuel (2017): 447.9 million metric tons
CO2 emissions from fossil fuel per person (2017): 5.5 metric tons
Change from CO2 emissions in 1992: 181.6%
Methane emissions (2012): 78.9 million metric tons (CO2e)
Population (2017): 80.7 million
GDP per capita (2017): $25,135 - Australia
CO2 emissions from fossil fuel (2017): 413.1 million metric tons
CO2 emissions from fossil fuel per person (2017): 16.8 metric tons
Change from CO2 emissions in 1992: 45.0%
Methane emissions (2012): 125.6 million metric tons (CO2e)
Population (2017): 24.6 million
GDP per capita (2017): $44,643 - United Kingdom
CO2 emissions from fossil fuel (2017): 384.7 million metric tons
CO2 emissions from fossil fuel per person (2017): 5.8 metric tons
Change from CO2 emissions in 1992: -35.2%
Methane emissions (2012): 59.0 million metric tons (CO2e)
Population (2017): 66.0 million
GDP per capita (2017): $39,884 - France
CO2 emissions from fossil fuel (2017): 356.3 million metric tons
CO2 emissions from fossil fuel per person (2017): 5.3 metric tons
Change from CO2 emissions in 1992: -14.9%
Methane emissions (2012): 81.2 million metric tons (CO2e)
Population (2017): 67.1 million
GDP per capita (2017): $38,808 - Italy
CO2 emissions from fossil fuel (2017): 355.45 million metric tons
CO2 emissions from fossil fuel per person (2017): 5.9 metric tons
Change from CO2 emissions in 1992: -19.1%
Methane emissions (2012): 35.2 million metric tons (CO2e)
Population (2017): 60.5 million
GDP per capita (2017): $35,343 - Thailand
CO2 emissions from fossil fuel (2017): 330.84 million metric tons
CO2 emissions from fossil fuel per person (2017): 4.8 metric tons
Change from CO2 emissions in 1992: 206.1%
Methane emissions (2012): 106.5 million metric tons (CO2e)
Population (2017): 69.0 million
GDP per capita (2017): $16,279 - Poland
CO2 emissions from fossil fuel (2017): 326.6 million metric tons
CO2 emissions from fossil fuel per person (2017): 8.6 metric tons
Change from CO2 emissions in 1992: -10.2%
Methane emissions (2012): 65.1 million metric tons (CO2e)
Population (2017): 38.0 million
GDP per capita (2017): $27,344 - Kazakhstan
CO2 emissions from fossil fuel (2017): 292.6 million metric tons
CO2 emissions from fossil fuel per person (2017): 16.2 metric tons
Change from CO2 emissions in 1992: 25.6%
Methane emissions (2012): 71.4 million metric tons (CO2e)
Population (2017): 18.0 million
GDP per capita (2017): $24,079 - Spain
CO2 emissions from fossil fuel (2017): 281.4 million metric tons
CO2 emissions from fossil fuel per person (2017): 6.0 metric tons
Change from CO2 emissions in 1992: 12.4%
Methane emissions (2012): 37.2 million metric tons (CO2e)
Population (2017): 46.6 million
GDP per capita (2017): $34,269 - Taiwan
C2 emissions from fossil fuel (2017): 271.5 million metric tons
CO2 emissions from fossil fuel per person (2017): 11.5 metric tons
Change from CO2 emissions in 1992: 89.4%
Methane emissions (2012): Not available
Population (2017): 23.5 million
GDP per capita (2017): $24,971 - Malaysia
CO2 emissions from fossil fuel (2017): 254.6 million metric tons
CO2 emissions from fossil fuel per person (2017): 8.1 metric tons
Change from CO2 emissions in 1992: 241.9%
Methane emissions (2012): 34.3 million metric tons (CO2e)
Population (2017): 31.6 million
GDP per capita (2017): $26,824
Have you read?
# World’s Top 50 Universities For Social Sciences Degrees, 2019.
# World’s Top 50 Universities For Business And Economics Degrees, 2019.
# World’s Top 50 Universities For Engineering And Technology Degrees, 2019.
# World’s Top 50 Universities For Computer Science Degrees, 2019.
# World’s Best Universities For Sport Science And Management In 2019.
Add CEOWORLD magazine to your Google News feed.
Follow CEOWORLD magazine headlines on: Google News, LinkedIn, Twitter, and Facebook.
This report/news/ranking/statistics has been prepared only for general guidance on matters of interest and does not constitute professional advice. You should not act upon the information contained in this publication without obtaining specific professional advice. No representation or warranty (express or implied) is given as to the accuracy or completeness of the information contained in this publication, and, to the extent permitted by law, CEOWORLD magazine does not accept or assume any liability, responsibility or duty of care for any consequences of you or anyone else acting, or refraining to act, in reliance on the information contained in this publication or for any decision based on it.
Copyright 2024 The CEOWORLD magazine. All rights reserved. This material (and any extract from it) must not be copied, redistributed or placed on any website, without CEOWORLD magazine' prior written consent. For media queries, please contact: info@ceoworld.biz
SUBSCRIBE NEWSLETTER