
Google Data Studio reporting is a great way to get a lot of information and filter it onto one “canvas” to showcase to the person you’re doing SEO or web traffic reporting for – and in a way you can add text and move things around.
Because it’s a Google product, it integrates seamlessly with Google Analytics and Google Search Console – so if you’re familiar with those products, you should be able to understand the basics of Google Data Studio without missing a beat.
Some methods of filtering and some of the more dynamic (and thus extremely useful) aspects of Data Studio take a little bit more time, like calculating estimated revenue from the leads you’re generating.
#1. The beauty of an open interface – bringing in screenshots from other web apps
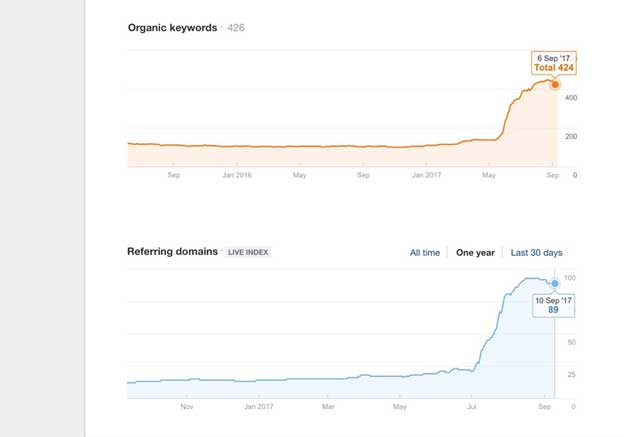
Analytics + Search Console + a Google Docs / Word like interface = a perfect way to curate information in general. I’ve tried an app called Dash.this for reporting, and Megalytics – one had a slick interface but it was too closed off, and one had a more open interface, but the elements didn’t update dynamically. Google Data Studio has the best of both worlds, as evidenced by the ease of importing screenshots from another SEO tool I love, Ahrefs.com
#2. Adding Monthly Reports on Activities, Next Steps, and Goals
Another simple feature that I love utilizing on Google Data Studio is the ability to add my next steps, and previously completed monthly items right there before the dynamic data. I can also add the goal for the month next to the actual if I like.
#3. E-commerce revenue reporting based on traffic sources
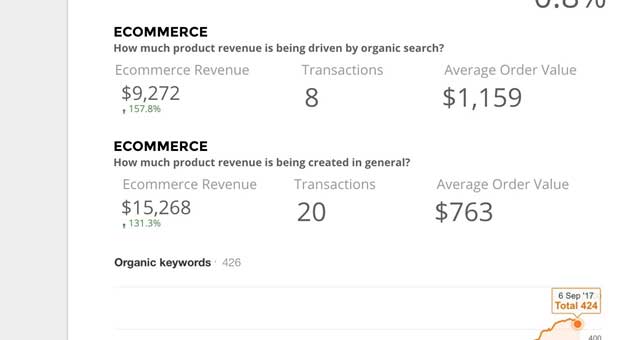
If you’re familiar with Analytics – it’s obviously easy to filter revenue by the source when you have E-commerce conversion tracking set up, but filtering it would require a live demonstration without some kind of easy to see dashboard.
Analytics has this feature, but it’s harder to maneuver and showcase, whereas Data Studio makes it easy. You can do a month over month or year over year comparison, or choose any range of dates that makes sense for the particular reporting schedule or client.
#4. Filtering your top traffic producing keywords and showing your client the impressions, clicks, and average position
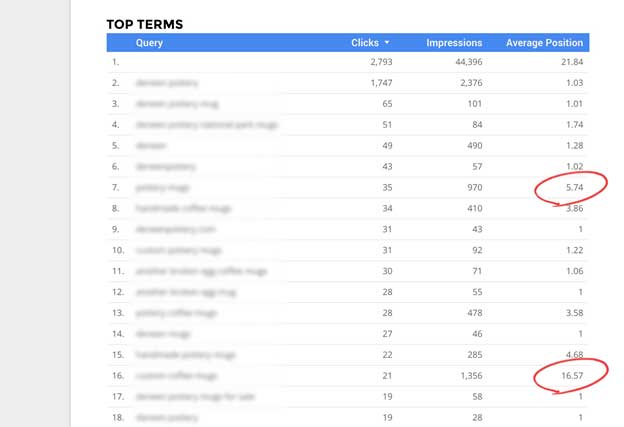
Because my strategy for driving traffic so often includes looking through these terms and figuring out what’s currently working to bolster that effort further, so I look at what has a high amount of impressions but not clicks. Also, I can look for items high on the list that are not the top three, so it’s easy to see that they actually have a lot of monthly searches, thus getting them higher would result in even more clicks.
This is my normal thought process when looking for SEO opportunities – but Google Data Studio allows me to talk the client through that targeting process, so they understand why I’m putting my effort in certain areas with content and earning backlinks for certain things.
#5. Using Google Data Studio for Estimated Revenue from Form Submissions
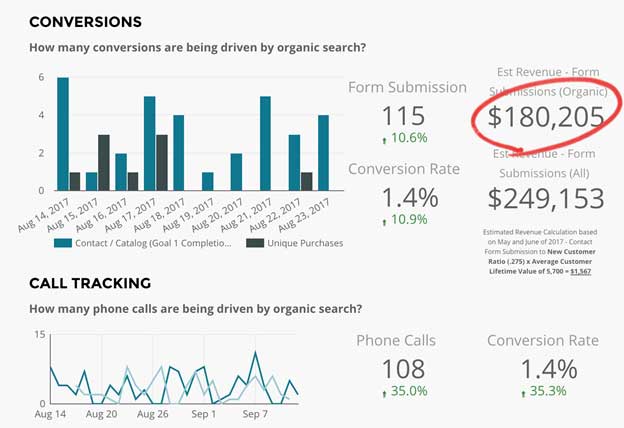
This is one of my favorite aspects about reporting in Google Data Studio – you simply find what the average ‘Customer Lifetime Value’ (CLV) is for the client and the percentage of leads that end up becoming customers. If you multiply that percentage by the average CLV you get what each contact form submission is worth on average – you can do the math dynamically on your Google Data Studio dashboard like this:
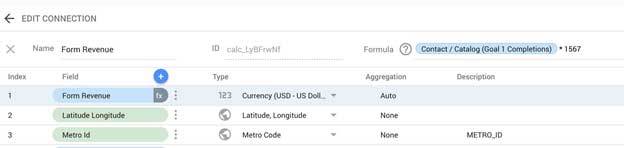
So for instance, in this case, each organic lead will be worth on average of $1,567. And then we can see how much revenue the site has brought in, in an estimated way on the dashboard and showcase this to the client. Progress in dollars is far more persuasive than progress in pure lead numbers, so it’s good to update this number when needed, so it’s as close to accurate as possible!
Thank you for reading and I hope you enjoy your reporting efforts – Google Data Studio is worth taking a look at if you haven’t already. It’s free – It just takes some getting use to to get the most out of it.
Add CEOWORLD magazine to your Google News feed.
Follow CEOWORLD magazine headlines on: Google News, LinkedIn, Twitter, and Facebook.
This report/news/ranking/statistics has been prepared only for general guidance on matters of interest and does not constitute professional advice. You should not act upon the information contained in this publication without obtaining specific professional advice. No representation or warranty (express or implied) is given as to the accuracy or completeness of the information contained in this publication, and, to the extent permitted by law, CEOWORLD magazine does not accept or assume any liability, responsibility or duty of care for any consequences of you or anyone else acting, or refraining to act, in reliance on the information contained in this publication or for any decision based on it.
Copyright 2024 The CEOWORLD magazine. All rights reserved. This material (and any extract from it) must not be copied, redistributed or placed on any website, without CEOWORLD magazine' prior written consent. For media queries, please contact: info@ceoworld.biz
SUBSCRIBE NEWSLETTER