
Before delving into the examination of methods for achieving the economic growth of companies, it is essential to describe economic growth within the context of the conducted research. This description aims to eliminate any ambiguity surrounding this category of economic knowledge.
The economic growth of a company is characterized by the expansion of the enterprise’s activities, manifested through the growth of key indicators in three areas of operation:
- Production (increase in the volume of final products or services provided),
- Investment (heightened investment activity or the rate of return on invested capital),
- Financial (augmentation of the ultimate financial outcome as a result of business operations).
True economic growth of a company can be asserted only when all three scalability conditions are met. Claiming genuine economic growth in cases where one or two conditions are fulfilled is not economically advisable. In such instances, a contradictory element in the overall dynamics of indicators exists, which can substantially alter the economic landscape in both forecasted and post-forecast periods.
There are several methodological approaches to modeling the economic growth of a company. Here are some of them:
- Exogenous growth models: The Ramsey-Cass-Koopmans model and the Solow model are examples of models with constant returns to scale. These are classical approaches that take into account the accumulation of capital and labor, with economic growth depending on technological progress and productivity factors.
- Endogenous growth models: These models consider internal factors within a company’s environment, such as innovation, education, research, and development. Examples include the Romer model and the Lucas model.
- Mix models: A mixed concept refers to a combination of factors from both the external and internal environment.
These are just some of the methodological approaches to modeling the economic growth of a company. The choice of a specific approach depends on the goals and context of the research. In the context of this study, there is no intention to categorize models within specific concepts. Instead, we will consider general contemporary and relevant methodological approaches without adhering to the identification of a particular concept.
The Inwood, The Hoskold and Ring Models
These models are based on the assumption that the income generated from a company’s core operations is capitalized for a certain specific period. In this case, the business is valued as generating a certain constant (average) income I over a limited operational period. Therefore, the minimum required return on investment is equal to the risk-adjusted return of a comparable investment alternative, plus a return that ensures the return of the invested capital.
In other words, considering the limited investment horizon, the valuation of the business incorporates a current yield rate (d) along with a capital accumulation rate required for capital recovery.
In this context, the formula for estimating the value takes the following form:

Where:
PV – present value of the business;
I – constant cash flow (income);
d – discount rate that accounts for the business’s risks;
C – capital accumulation rate for capital recovery.
The Inwood and Hoskold models are applicable for the valuation of companies in which a significant portion of assets are economically consumed (due to a decline in demand for products that can be produced using those assets) over the course of business operations. These assets cannot be resold at the end of the business, thus making it impossible to recover the invested capital through resale. In essence, there exists a constant cash flow (income I ) for a certain period n. The difference between the Inwood, Hoskold, and Ring models lies in the capital recovery rate (C), as we’ll discuss below.
Models of capitalization of a constant cash flow (income) can be represented in the form of formulas:
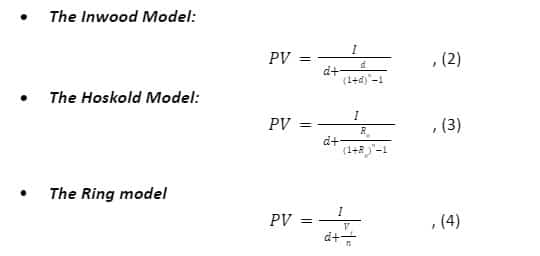
Where:
R0 – risk-free rate in government bonds or insured bank deposits;
n – number of income periods, business lifespan;
Vf – Future Value of each invested ruble.
For businesses with long lifespans, the Hoskold model can potentially underestimate its value, as it fails to account for the risks of potentially reinvesting the accumulated funds into risky investment alternatives (including the potential expansion of the same enterprise with similar risk levels), rather than risk-free investment instruments such as insured bank deposits or government bonds. As a result, the capital accumulation rate in the Holdsworth model becomes disproportionately high for longer lifespans (n), as the denominator includes the rate R0, which by definition is lower than d. This leads to an unjustifiably high capital accumulation rate.
Conversely, for businesses with short lifespans, the Holdsworth model can overestimate its estimated value. In the Ring model, the capital recovery requirement is simpler: Vf represents the amount of extracted income capable of providing equal portions of capital recovery over a specified period n.
In the Ring model (especially when evaluating industrial businesses), the depreciation of specialized assets (technological equipment, know-how, etc.) due to economic (moral) obsolescence after a certain period may not be fully accounted for. This can lead to an overestimation of Vf and a reduction in the valuation determined by the capitalization method.
Stewart-Stern Model
Economic Value Added (EVA) is understood as the difference between the net after-tax operating profit and the cost of capital. It represents the value that a company generates through its business activities at the current yield rate (return rate), considering the weighted average cost of capital.
Economic Value Added characterizes the value that a company generates through its economic activities at the current yield rate (return rate), considering the weighted average cost of capital. The Economic Value Added model can be presented using two alternative formulas for calculation, as given in formulas 5 and 6, depending on the evaluation objectives:
EVA = [NOPAT – WACC] •CE , (5)
Where:
NOPAT – Net Operating Profit After Tax;
WACC – Weighted Average Cost of Capital;
CE – Capital Employed.
EVA = [ROI – WACC] • CЕ , (6)
Where:
ROI – Return on Investment.
The main advantages of this model include its simplicity of practical application and the clarity of the results it provides.
Comparable Model
The market-based comparable model relies on comparing a company’s economic growth by assessing its performance against analogous companies within the market environment. This evaluation is conducted through the use of multiples, which can be grouped for assessment purposes based on the scale of the company’s operations and its legal structure. Multiples are relative valuation metrics, and their comparison, given the conditions (scale, legal structure, product type), allows for determining the company’s state (growth, stagnation, decline) relative to its competitors, guided by the market environment and industry peers.
It’s important to note that a significant advantage of this model is its alignment with the market and market conditions. An illustrative example and the calculation methodology for multiples are presented in Table 1 below.
Table 1: Market-Based Model for Evaluating Company
| Company Metrics (Direct Calculation) |
| + Revenue (REV) |
| – Cost of Goods (COGS) |
| = Gross Margin |
| – Operating Expenses |
| + Depreciation and Amortization |
| = Earnings Before Interest, Tax, Depreciation, and Amortization (EBITDA) |
| – Interest Expense / Tax |
| = Net Profit (NP) |
| Common Stock: The par value of shares issued to shareholders (P) |
| + Current Liabilities (CL) |
| – Cash and Cash Equivalents |
| = Enterprise Value (EV) |
| Total Assets |
| – Intangible Assets + Goodwill |
| – Current Liabilities (CL) |
| = Net Assets (NA) |
| Current Assets (CA) |
It should be noted that depending on the company’s legal structure, the groups of multiples can vary, as shown in Table 2.
Table 2: Grouping of Multiples by Company Form and Segment Overall
| Weighted Average Multiples across the Economy Segment | Weighted Average Multiples for Public Company | Weighted Average Multiples for Private Company | |||
| В / EBITDA | |||||
| B / REV | |||||
| EV / EBITDA | EV / EBITDA | ||||
| EV / REV | EV / REV | ||||
| P / E | P / E | ||||
| P / REV | P / REV | ||||
| P / B | P / B | ||||
| ROA = E / B | ROA = E / B | ROA=E / B | |||
| ROS = E / REV | ROS = E / REV | ROS=E / REV |
Table 2 demonstrates that the choice of multiples may differ based on the company’s legal structure, with public and private companies emphasizing different groups of multiples for their valuation.
It’s worth highlighting that the market-based model utilizing multiples provides a straightforward approach to evaluating a company’s economic growth potential, offering valuable insights into its performance relative to peers and market conditions.
Conclusions
It should be noted that within the scope of this study, it is not feasible to cover all models of company economic growth under existing methodological approaches. It is worth mentioning the significant presence of endogenous models, one of which we presented in the study, models based on innovative development, and effective utilization of human capital. In this article, we have defined contemporary models of company economic growth that have substantial practical applicability and universality for practical implementation.
Written by Anna Bolotova.
Have you read?
The 4 Most Influential Female CEOs In The Telecom Industry, 2023.
The 50 Richest People in the Philippines, 2023 List.
The Richest Billionaires in Each Country, 2023.
These Are the most overpaid CEOs among S&P 500 companies, 2023.
These Are the highest-paid CEOs among S&P 500 companies, 2023v.
Highest-paid CEOs among Russell 3000 companies, 2023.
Add CEOWORLD magazine to your Google News feed.
Follow CEOWORLD magazine headlines on: Google News, LinkedIn, Twitter, and Facebook.
This report/news/ranking/statistics has been prepared only for general guidance on matters of interest and does not constitute professional advice. You should not act upon the information contained in this publication without obtaining specific professional advice. No representation or warranty (express or implied) is given as to the accuracy or completeness of the information contained in this publication, and, to the extent permitted by law, CEOWORLD magazine does not accept or assume any liability, responsibility or duty of care for any consequences of you or anyone else acting, or refraining to act, in reliance on the information contained in this publication or for any decision based on it.
Copyright 2024 The CEOWORLD magazine. All rights reserved. This material (and any extract from it) must not be copied, redistributed or placed on any website, without CEOWORLD magazine' prior written consent. For media queries, please contact: info@ceoworld.biz
SUBSCRIBE NEWSLETTER