
Manage Projects Efficiently With Data Analytics: The 70% Rule

PROBLEM: If you are a manager in charge of a data intensive project with multiple data sources, diverse data formats, various requirements and limited human resources, such as in the pharmaceutical industry, chances are your team will perform a lot of the task steps manually – entering data into spreadsheets, modifying data, input into legacy computer systems, etc.
The management of this kind of projects is often difficult if not dreadful. Errors could also be introduced in the process and you might have to repeat the same steps to fix the problems, forming a vicious cycle. In the end, the project is often over deadline and budget with unsatisfactory results – we have seen too many of these.
SOLUTION: It’s time for a shift in the corporate strategies to better allocate and organize resources to achieve better results. In this era of big data, we know a lot about statistics and data distributions, as well as a wealth of data analytical tools. Most of the data in a project have some common properties that could be utilized in a programmatic way to drive an automation solution for the tasks at hand.
For example, if data elements of the same value are to be copied to some other locations, this task can be programmed to execute in a loop algorithm, or if different data elements are to be cross-matched by values, a data look up operation can be used to automate the steps. If we quantify the difficulty and worthiness of automating the tasks (automation complexity) and assign it to variable X, then we believe X follows a Normal Distribution (Figure 1). The mean and standard deviation of X will depend on the general complexity and task characteristics of the project, and obviously, the skills of the data analysts who program the automation will determine how much efficiency improvement can be achieved for a particular project.
Empirically, I have found that about 70% of increase in productivity can be realized, roughly corresponding to the volume of task elements within 1 standard deviation, two tailed (68% in a Normal Distribution). In most of the cases, the resources needed to create the analytical programs are fixed and negligible compared to the whole projects.
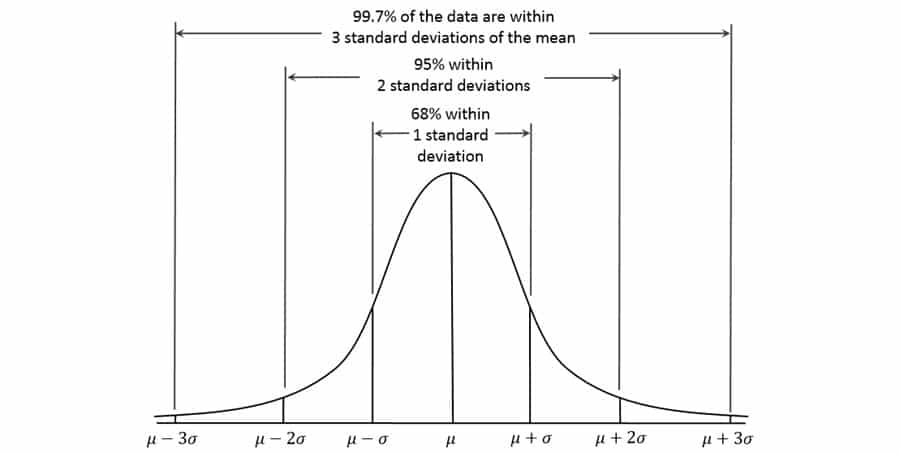
Figure 1. Standard Normal Distribution
APPLICATIONS: The following are two user cases that demonstrate this empirical 70% rule with regard to project management.
CASE 1
There is often a process in Pharmacovigilance called data reconciliation where serious adverse events (SAE) for the same clinical trial but from different sources are reconciled to ensure data integrity. The following are some sample Safety Database and Clinical Database SAE records for the same clinical trial. (For privacy reason, all essential data are replaced with tokens).
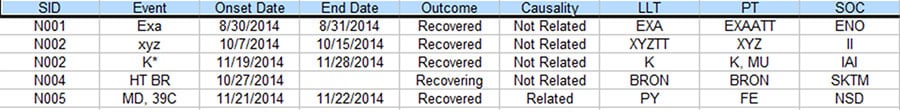
Figure 2. Partial listing of SAE data from the Safety Database
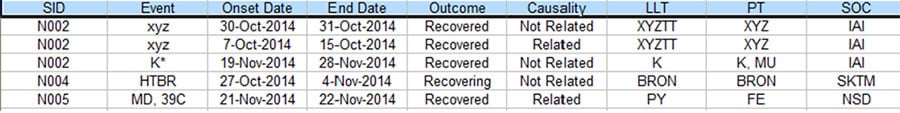
Figure 3. Partial listing of SAE data from the Clinical Database
As you can see, there are quite a few discrepancies between the two listings when they are supposed to be the same. With the lack of standardized commercial tool to address this issue, a lot of the Patient Safety teams have to rely on manual comparison of the above listings to resolve the discrepancies, which typically takes 2-4 people several days to complete for a medium sized data listing, In order to improve the process based on the empirical 70% rule, a project was set up to analyze the task elements and data flow of this process. As a result, a data analytical program was created and a new process was implemented.
Figure 4 is the output from the process that displays the discrepancies of the two SAE data sources. Every row accommodates two text lines for easy visual comparison, with one each from the two SAE data sources. Only the discrepant values of the column / fields are printed for clarity purpose. For missing or extra records, all fields are printed with ‘?’ as placeholders.
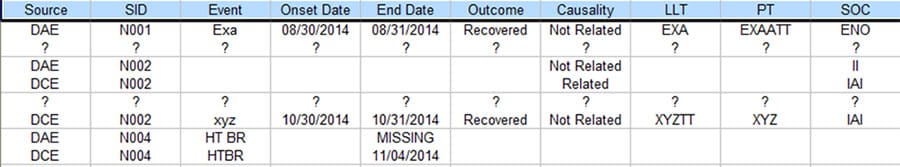
Figure 4. Output Table that Shows the Discrepancies
The new process was able to complete within hours for 2 people, greatly improved productivity beyond 70% while achieving 100% accuracy.
CASE 2
A complicated data table from a public website needs to be migrated to a web application with legacy database backend. Historically, the data table started from the web application but then grew and changed independently from the original base. So the project is to move the newer data from public website to legacy web application through the user interface. See Figure 5 (key data have been replaced with tokens).
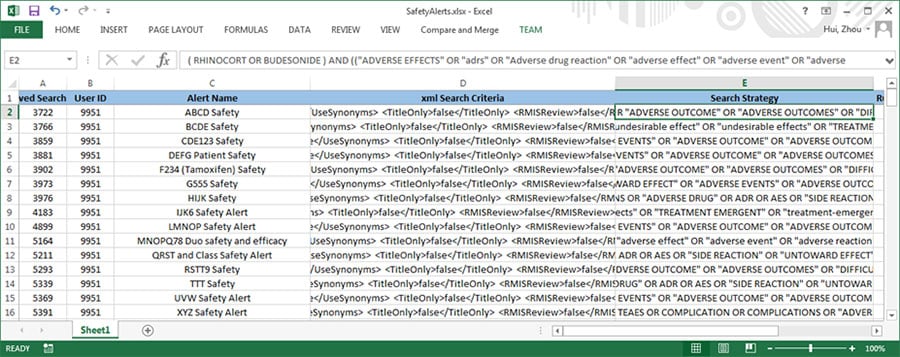
Figure 5. Sample data going through analysis and migration
Initial estimate shows it will take roughly 6 month for 2 people, if everything goes smoothly.
Based on the empirical 70% rule, the task elements were classified. Analytical codes were written to clean, normalize and cross-match the data. Reorganized data were imported into the backend database directly without going through the user interface.
As a result, this project was completed in 2 months by 2 people without any revisits, a 70% improvement in productivity compared to the original best-case scenario.
CONCLUSION
IN A DATA INTENSIVE PROJECT, GIVEN THE RIGHT TEAM WITH INTEGRATED UNDERLYING BUSINESS KNOWLEDGE AND DATA ANALYTICS EXPERIENCE, IMPROVEMENT OF ABOUT 70% ON PRODUCTIVITY AS WELL AS QUALITY IS COMMONLY ACHIEVABLE.
—————————————–
Have you read?
The world’s 19 most expensive cities to set up a business, 2016
The Best Business Schools in Europe, 2016
These are the 40 smartest people of all time
Leading the Way – How a healthy workplace starts from the top
Written by: Tom Zhou Hui, MD, MSBME, RAC
Business Tool Manager and Patient Safety Senior Scientist at AstraZeneca.
He is currently Business Tool Manager / Senior Scientist for Patient Safety with AstraZeneca, a global, science-led biopharmaceutical company that focuses on the discovery, development and commercialisation of prescription medicines, primarily for the treatment of diseases in three main therapy areas – Respiratory and Autoimmunity, Cardiovascular and Metabolic Diseases, and Oncology.
Prior to that, Zhou (Tom) Hui worked for several companies as medical device and data software developer as well as biomedical manager from 1993 to 2004. He holds a MD from Nanjing Medical University, a MS in Biomedical Engineering from University of Texas Southwestern Medical Center at Dallas and a RAC from Regulatory Affairs Professionals Society. AstraZeneca operates in over 100 countries and its innovative medicines are used by millions of patients worldwide.
The views expressed in this article are those of the author alone and not the CEOWORLD magazine.
Add CEOWORLD magazine to your Google News feed.
Follow CEOWORLD magazine headlines on: Google News, LinkedIn, Twitter, and Facebook.
This report/news/ranking/statistics has been prepared only for general guidance on matters of interest and does not constitute professional advice. You should not act upon the information contained in this publication without obtaining specific professional advice. No representation or warranty (express or implied) is given as to the accuracy or completeness of the information contained in this publication, and, to the extent permitted by law, CEOWORLD magazine does not accept or assume any liability, responsibility or duty of care for any consequences of you or anyone else acting, or refraining to act, in reliance on the information contained in this publication or for any decision based on it.
Copyright 2024 The CEOWORLD magazine. All rights reserved. This material (and any extract from it) must not be copied, redistributed or placed on any website, without CEOWORLD magazine' prior written consent. For media queries, please contact: info@ceoworld.biz
SUBSCRIBE NEWSLETTER