
When setting regional goals, you need hard data to back up your position. Otherwise, you might be setting goals that are unsuitable. Market data allows you to quantify the opportunity. When you know the opportunity, you can plan revenue targets, resources and investment at the right level to help the team deliver.
To elaborate, imagine a scenario where a global AEC (architecture, engineering and construction) software vendor, called Imaginary Software, is trying to set regional sales targets. This will involve the development of a set of charts to support a meeting between the CMO and the three regional heads – of AMER, APAC and EMEA*.
The approach is to look at the regional market size and growth from several different points-of-view:
- What is the performance of Imaginary Software’s competitors? What will their growth be?
- What growth is forecast in the vertical market sectors served by Imaginary Software?
- How many potential users of Imaginary Software’s products are based in each of the regions?
Competitor view
In our example, just five providers are the source of competition for Imaginary. The available product group analysis for these five providers is shown in Chart 1. The 15 product groups that compete with Imaginary are shown in bold.
| Provider | Product Group |
| Autodesk | AutoCAD LT, AutoCAD Platform, Building, Civils, Geospatial, Manufacturing,M&E Animation, M&E Systems, Other |
| Bentley | Building, Civil, Geospatial, Plant |
| Fukui | Architrend, Bluetrend, Extrend |
| Nemetschek | AllPlan, ArchiCAD, Cinema 4D, SCIA, Structures, VectorWorks |
| RIB | iTWO, Civil, Construction |
Chart 1: Product Groups competitive with Imaginary Software’s business
Selection of the data for these product groups provides an immediate quantitative framework for this market, with both historic and forecast revenues for each product group in each of the three regions. For the goal of this scenario – setting sales targets – the aggregated growth numbers are critical, but, of course, the revenue figures for new licenses, maintenance and subscription, and professional services all help trigger insights and understanding of the market.
Competitor growth
One of the most important factors in goal setting is how much the market is growing (or declining). The forecast regional 2015 growths of the selected set of competitive products is shown in chart 2.
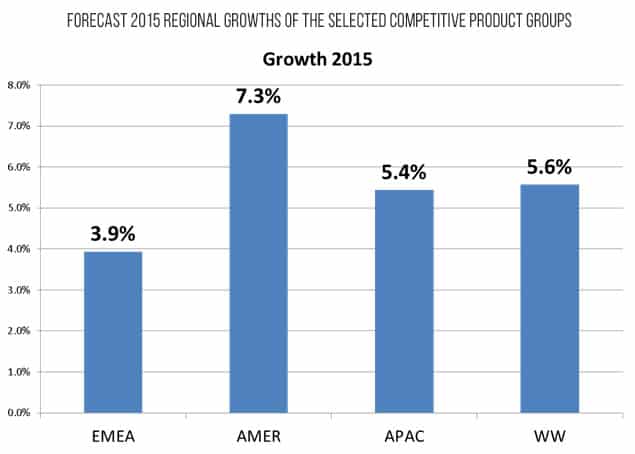
Chart 2: Forecast 2015 regional growths of the selected competitive product groups
Imaginary’s marketing objective is increasing market share. This means growing faster than the competition, so the EMEA team will need to beat the 3.9% growth of the competing products, APAC needs to better 5.4%, but AMER needs to top 7.3% growth. If you gave each region the target of growing at better than the global figure of 5.6%, then you’d be offering the Americas team a walk in the park, whereas the EMEA team would be facing a serious challenge. What would most likely happen is that you would lose market share in AMER, whilst failing to meet your target in EMEA (as the goal was unattainable), leading to a loss of market share overall.
Industry view
Remember the scenario. We are preparing data to help the CMO discuss next year’s targets for the regional heads. Their personal goals and bonuses will be based on this data, so it is important to get a second view of the growth numbers. An independent source of qualified and trusted industry sector analysis provides this second view. We have selected 13 verticals to define Imaginary’s AEC sector. The revenue figures for ‘technical application software EUE’ include CAD / CAM / CAE / PLM / GIS / BIM etc. This is a broader scope than the 11 product lines we looked at before (the competitors). This is helpful – if there are differences in the growth pattern for this broader market, then Imaginary’s offer (along with that of its competitors) is either growing or falling in importance compared to the other technical applications software used in AEC verticals.
Even before looking at the growth, the availability of data that divides Imaginary’s AEC sector into 13 sub-sectors drives insights into market opportunity. When you look at the technical applications spend across the 13 sectors, the majority is in the service and consultancy segments, such as architecture firms or civil engineering consultants. This view can help the CMO, the regional heads, and in due course, their sales teams, answer the question “Who should we sell to?”
Industry growth
For the purposes of goal setting, we need to look at the forecast growth of this AEC market in relation to the group of competitors we used earlier – see chart 3.
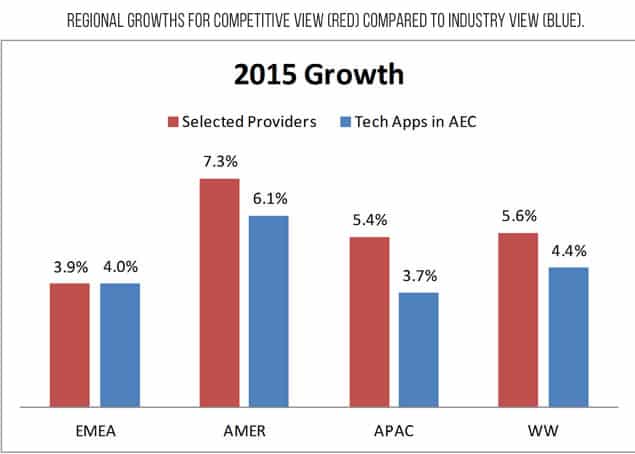
Chart 3: Regional growths for competitive view (red) compared to industry view (blue).
This shows up some interesting trends:
- The selected providers are growing faster in 2015 than the AEC sector as a whole – 5.6% vs. 4.4%.
- This difference isn’t uniform around the world – in EMEA, the difference is negligible, but in the Americas it’s 1.2% and in APAC it’s 1.7%.
For the meeting with the regional heads, this helps put the 2015 growth figures in context. Depending on which way they want to argue, they may regard the selected product lines as unrepresentative of their market opportunity because it’s too narrow (different technology, different sales cycle, different decision makers in user organizations). And they may regard the growth of the broader ‘technical applications’ as similarly unrepresentative because it’s too broad. So it may well be that the CMO will choose to use these two views as upper and lower bounds of what to expect if Imaginary simply follows the market.
This chart may also prompt an interesting discussion on ‘what is going on in EMEA?’ Why is it that 11 product lines from five providers are achieving ‘better than overall AEC segment’ growth in APAC and the Americas, but are only just about level with AEC in EMEA? That’s a discussion for another day, but I think I’d expect questions about the 11 product lines. So if this was a real meeting, I think I would create some backup slides – 11 versions of chart 3 to show each of the 11 product lines separately instead of this single aggregated view would certainly stimulate discussion about successful strategies around the world.
Employment view
The third view of the market is looking at the employment distribution. We can pick the same set of 13 industry sectors as for the Industry Observatory to look at the same ‘AEC’ market. There are 208 million people employed across the world in these sectors. The majority of these people are in “trade” or non-technical occupations. Imaginary is focused on the 8 million professional engineers in this group of 208 million employed people.
These 8 million are distributed amongst 16 different detailed engineering occupations – see chart 4.
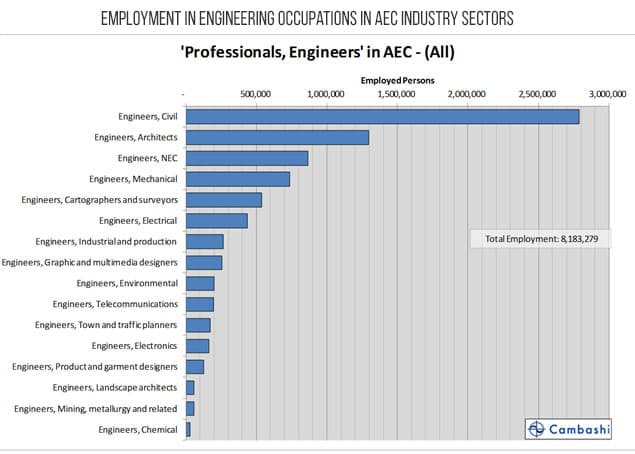
Chart 4: Employment in engineering occupations in AEC industry sectors
This range of ‘types’ of professional engineer may trigger questions that the CMO wants to think about – in what way does Imaginary Software’s offer address the needs of each of these groups? If the existing user base has a different shape, why is that? Which job categories do we truly believe can use the products? Do Imaginary’s marketing materials articulate the offer in terms that will resonate with each of them? Could Imaginary achieve competitive advantage by doing something special for one of these categories?
Imaginary believes that very often, the key person in an account who tends to be the key influencer has an ‘Architect’ job title. So the distribution of the (approximately) 1.3 million people classified as ‘Engineers, Architects’ – the second bar down in chart 4 – could be interesting. This breakdown is shown in chart 5.
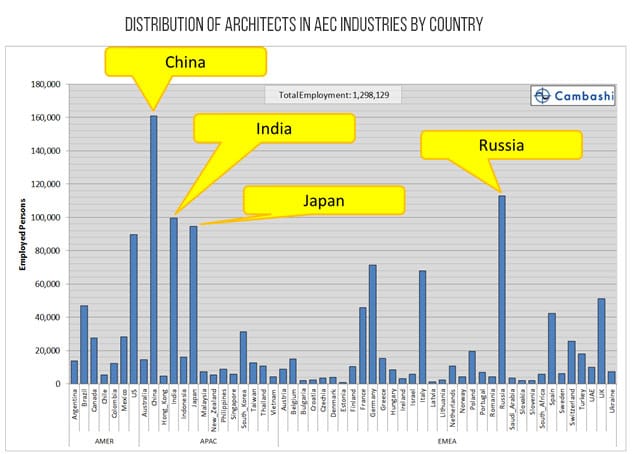
Chart 5: Distribution of architects in AEC industries by country
It’s interesting that Japan has more than the US; (potentially understandable – not much land area, plus earthquakes together probably means more work for architects). But Russia has even more – which may say something about the industry structure in Russia, or possibly the way occupations are classified there.
A headcount is no substitute for revenue numbers. But the point is that if you are seeking some view of total available market, and how much more opportunity there is for your software in the world, employment figures give you a handle. You have to be careful of course – new technology can affect employment patterns, so not all these people will be there as technology automates their jobs. And each country is probably at a different phase of the cycle of take-up of your technology. But one way of searching for unusual things going on in the business is to group ‘similar’ countries together – Northern Europe, Southern Europe, Oil States, and so on, and adjust for the sales effort you are putting in, then do a calculation of revenue you are achieving per employee in your target sectors. You will get a bit of a range of numbers, but it is definitely worth looking at the best ‘outlier’ countries for a factor that is making them into outliers – then replicate best practice.
Conclusion
Market datasets provide a quantitative framework for business decision-making. In this scenario, we’ve looked at revenue growths. The regional heads know that Imaginary wants to gain share. I think the CMO will be able to convince them that beating the market means different growth targets in each region. Comparing figures based on different perspectives improves confidence in the figures. Here, looking at performance of competitor product groups, and also at vertical industry software spend helps get a feel for the accuracy of these figures, and also, given the context of other products, and the detailed vertical sectors, some insight into the hotspots in the market. – In this scenario, I expect everyone will agree to split the difference between the growth of the benchmark competitor product groups, and the growth of tech apps in the AEC sector, to get a baseline regional growth target. Having said that, I’d be fairly sure the heads of EMEA and APAC will point out that growths calculated in US$ may depend more on exchange rate calculations than real changes in the market. So I’d probably pull the Euro figures and, for Japan, the Yen figures as well, ready for the follow up discussion.
I also expect the relative sizes of the subsectors that make up the AEC sector will trigger some discussion. The fact that service and consultancy sectors spend most on technical application software may help Imaginary Software make choices about product development, resource allocation, staff training, advertising and so on.
Even after currency adjustments, it looks like the Americas will get the largest percentage growth target, and that will trigger discussion on headcounts and budgets as well as the content of any sales and marketing initiatives that head-office plan to roll-out to the regions. That will be a real chance for these four senior people to add-value to the business.
The employment view will then give the CMO some insight into what types of messages will work for the target users.
Overall, this illustration shows how some well-sourced data sets and a knowledgeable marketing intelligence person can support successful goal setting.
*****************
(By Dan Roberts, Senior Consultant, Cambashi)
*AMER= America; APAC= Asia Pacific; EMEA= Europe, Middle East, and Africa.
Add CEOWORLD magazine to your Google News feed.
Follow CEOWORLD magazine headlines on: Google News, LinkedIn, Twitter, and Facebook.
This report/news/ranking/statistics has been prepared only for general guidance on matters of interest and does not constitute professional advice. You should not act upon the information contained in this publication without obtaining specific professional advice. No representation or warranty (express or implied) is given as to the accuracy or completeness of the information contained in this publication, and, to the extent permitted by law, CEOWORLD magazine does not accept or assume any liability, responsibility or duty of care for any consequences of you or anyone else acting, or refraining to act, in reliance on the information contained in this publication or for any decision based on it.
Copyright 2024 The CEOWORLD magazine. All rights reserved. This material (and any extract from it) must not be copied, redistributed or placed on any website, without CEOWORLD magazine' prior written consent. For media queries, please contact: info@ceoworld.biz
SUBSCRIBE NEWSLETTER